

Abstract
Sub-Saharan West Africa is a vulnerable region where a better quantification and understanding of the impact of climate change on crop yields is urgently needed. Here, we have applied the process-based crop model SARRA-H calibrated and validated over multi-year field trials and surveys at eight contrasting sites in terms of climate and agricultural practices in Senegal, Mali, Burkina Faso and Niger. The model gives a reasonable correlation with observed yields of sorghum and millet under a range of cultivars and traditional crop management practices. We applied the model to more than 7000 simulations of yields of sorghum and millet for 35 stations across West Africa and under very different future climate conditions. We took into account 35 possible climate scenarios by combining precipitation anomalies from −20% to 20% and temperature anomalies from +0 to +6 °C.
We found that most of the 35 scenarios (31/35) showed a negative impact on yields, up to −41% for +6 °C/ − 20% rainfall. Moreover, the potential future climate impacts on yields are very different from those recorded in the recent past. This is because of the increasingly adverse role of higher temperatures in reducing crop yields, irrespective of rainfall changes. When warming exceeds +2 °C, negative impacts caused by temperature rise cannot be counteracted by any rainfall change. The probability of a yield reduction appears to be greater in the Sudanian region (southern Senegal, Mali, Burkina Faso, northern Togo and Benin), because of an exacerbated sensitivity to temperature changes compared to the Sahelian region (Niger, Mali, northern parts of Senegal and Burkina Faso), where crop yields are more sensitive to rainfall change. Finally, our simulations show that the photoperiod-sensitive traditional cultivars of millet and sorghum used by local farmers for centuries seem more resilient to future climate conditions than modern cultivars bred for their high yield potential (−28% versus −40% for the +4 °C/ − 20% scenario). Photoperiod-sensitive cultivars counteract the effect of temperature increase on shortening cultivar duration and thus would likely avoid the need to shift to cultivars with a greater thermal time requirement. However, given the large difference in mean yields of the modern versus traditional varieties, the modern varieties would still yield more under optimal fertility conditions in a warmer world, even if they are more affected by climate change.
Export citation and abstract BibTeX RIS

Content from this work may be used under the terms of the Creative Commons Attribution-NonCommercial-ShareAlike 3.0 licence. Any further distribution of this work must maintain attribution to the author(s) and the title of the work, journal citation and DOI.
1. Introduction
Climate change is likely to adversely affect food security in many regions of the world, especially in developing countries where a large fraction of the population is already facing chronic hunger and malnutrition (Lobell et al 2008, Schmidhuber and Tubiello 2007). In such countries, the survival of the population will depend on the effective adaptation of agriculture to climate change. Better knowledge of climate impacts on crop yields is a pre-requisite for breeding more resilient crop varieties, or for adopting existing varieties more resistant to climate-induced stress—two different strategies to counteract the adverse effects of climate change on crop yields (Barnabás et al 2008). However any varietal adaptation will be challenging because of uncertainties both in regional climate changes scenarios (Christensen et al 2007) and in the response of crops to changing climate (Barnabás et al 2008). For Africa in particular, the meta-analysis of the results of 16 studies over West Africa (Müller 2011, Roudier et al 2011) shows that although projected impacts on yield are most frequently slightly negative (−10%), there is a large spread between results. This variation indicates a low confidence in future yield projections, with projected impacts on crop yields ranging from −50% to +90%. More recently, Knox et al (2012) estimate that mean yield change for all crops is −8% by the 2050s with strong variations among crops and regions. This diversity of impacts reflects the differences in these impact studies, which focus on different locations, and rely on different climate projections, crops and crop models, and downscaling techniques; the result is a large spread of crop yield projections (Sultan 2012). This low degree of confidence makes it difficult to aggregate and upscale such projections in order to provide a consistent assessment of future yield changes at regional or continental scale (Berg et al 2013).
There is thus a need to perform more consistent assessments of climate change impacts on crop yields at the regional scale in West Africa. In particular, it is necessary to account, as far as possible, for uncertainties in regional climate change scenarios. Indeed, the considerable spread in current climate model projections of regional climate change over West Africa, especially with respect to rainfall (Müller 2011, Roudier et al 2011), results in uncertainty in estimates of future crop yields; with the existing studies generally being based on too narrow a selection of climate projections. In addition, impact assessments need to quantify the uncertainty associated with the response of each crop type to a changing climate. Several different approaches exist to derive large-scale climate change impacts on crop yields, such as the use of empirical relationships between crop growth and climate (Lobell et al 2008, Schlenker and Lobell 2010) or the recent development of large-scale vegetation models including an explicit representation of croplands (Arneth et al 2010, Müller et al 2009, Berg et al 2013). Among these approaches the up-scaling of simulations from plot-scale process-based crop models over a larger regional domain (Jones and Thornton 2003, Liu et al 2008) allows the diversity of responses to be assessed accurately, including the effects of different cultivars and/or management practices. Especially in West Africa, farmers are able to select adapted varieties (e.g. late or early millet) or to adapt their practices (e.g. delayed or early sowing) to a changed environment (Dingkuhn et al 2006). The ability to identify the most suitable crop varieties, with the most robust characteristics for withstanding climate change, is crucial for formulating adaptation strategies in the region.
In this context, we studied an extensive set of yield simulations using a process-based crop model enabling us to assess the impacts of climate change on the yield of sorghum and millet, two staple crops in the Sudanian and Sahelian savannas of West Africa. The study took into account the diversity of local cultivars and the full range of climate scenarios. We first simulated future sorghum and millet crop yields at the scale of West Africa, and then identified the areas and crop cultivars most vulnerable to climate change. Finally, differences among cultivars in the response of millet and sorghum yields were discussed, identifying the characteristics of the robust cultivars needed to minimize yield loss in the face of climate change.
2. Materials and methods
2.1. Climate data
Three climate data sets are used in this study. First a set for 1961–90, compiled from 35 meteorological stations with time series at daily resolution located in 9 countries across West Africa (figure 1(a)). These data sets have been compiled by the AGRHYMET Regional Centre and National Meteorological Agencies. These stations record rainfall and several meteorological parameters at 2 m above ground level, such as solar radiation, surface wind speed, humidity and temperature. The data were used to perform crop growth simulations.

Figure 1. The performance of the crop model in the study region in West Africa. (a) Map of West Africa with location of weather stations (circles) and 1961–90 mean annual rainfall from CRU data (shaded areas and contours in mm yr−1). (b) Comparisons between simulated SARRA-H yield (multi-variety average of sorghum and millet) and observed FAO yield. The observed yield is an average of countries' national yield (Senegal, Mali, Burkina Faso, Niger, Guinea, Gambia, Guinea Bissau, Togo, Benin) weighted by the national cultivated area. A linear trend signal has been removed in both time series. A specific validation per crop and per country is shown in figure S1 (available at stacks.iop.org/ERL/8/014040/mmedia).
Download figure:
Standard imageSecond, Mitchell and Jones (2005) have produced a global gridded climate-observation database at the monthly timescale for 1901–2009 at 0.5° resolution (CRU TS 3.1 database; www.cru.uea.ac.uk/). We computed annual values across West Africa by averaging their rainfall and temperature data over the grid points from longitude 19°W to 17°E and from latitude 2.5°N to 25°N and computing the summer mean (May–September) rainfall amount and mean temperature. These data were used to define decadal climate anomalies relative to the 1961–90 reference period. For example, for the first decade of the twentieth century, we computed the summer temperature anomalies as the temperature differences between the 1901–10 average and the 1961–90 baseline average. Similarly, past summer rainfall anomalies were defined as the ratio of decadal rainfall to 1961–90 rainfall.
Third, monthly outputs from simulations over the 20th (20C3M, 1961–2000) and 21st (2001–2100) centuries were retrieved from the Program For Climate Model Diagnosis and Intercomparison (PCMDI) archive for several climate models and scenarios from CMIP3 (the World Climate Research Programme's Coupled Model Intercomparison Project phase 3 multi-model dataset); (table S3 available at stacks.iop.org/ERL/8/014040/mmedia) and CMIP5 (table S4 available at stacks.iop.org/ERL/8/014040/mmedia). Note that not all simulations from the CMIP5 exercise were available at the time of submitting this paper. For each Global Climate Model (GCM), we considered rainfall and mean daily temperature projections during summer (May–September) for two time periods (2031–50 and 2071–90), three emission scenarios based on the Special Report on Emissions Scenarios (A2, A1B, B1) for CMIP3 runs and three Representative Concentration Pathways (RCP 4.5, 6.0 and 8.5, the new emission scenarios used for the 5th IPCC report, Moss et al (2010)) for CMIP5 runs. We computed the summer temperature anomalies as the temperature differences between the future projection and the 1961–90 reference period from the GCM. Similarly, future summer rainfall anomalies were defined as the ratio of future rainfall to 1961–90 rainfall.
2.2. Crop yield simulations
2.2.1. The crop model SARRA-H v.32.
Sorghum and millet are the staple crops of sub-Saharan West Africa (64% of the total cereal production in 2000; FAOSTAT data). Here, we coupled a process-based crop model, SARRA-H, to a large ensemble of future climate projections, to assess how the yields of these crops could be impacted in the future. SARRA-H version v.32 is particularly suited for the analysis of climate impacts on cereal growth and yield in dry tropical environments (Dingkuhn et al 2003, Baron et al 2005, Sultan et al 2005). The crop model simulates yield attainable under water-limited conditions by simulating the soil water balance, potential and actual evapotranspiration, phenology, potential and water-limited assimilation, and biomass partitioning (see Kouressy et al 2008 for a detailed review of model concepts). The process-based crop model (see section 2) has already shown good performance in the analysis of climate impacts on tropical cereals (Mishra et al 2008, Oettli et al 2011), but here it was further calibrated against local agronomic-trial data. Agronomic trials and multi-year on-farm surveys were conducted in eight contrasted sites in terms of climate and agricultural practices in Senegal, Mali, Burkina Faso and Niger throughout the African Multidisciplinary Monsoon Analysis (AMMA) programme (Traoré et al 2011). These data were used to define the varieties and the parameters representing management practice in the crop model. On-farm surveys have shown the dominance of traditional cultivars of sorghum and millet characterized by a strong sensitivity to photoperiod (Traoré et al 2011). From these data, and in order to assess the diversity of crop characteristics, the parameters of six representative varieties (three varieties of sorghum and three varieties of millet) were selected and used to calibrate the model (see section 2). The varieties differ mainly by their growth-cycle length, and their sensitivity to photoperiod (table S1 available at stacks.iop.org/ERL/8/014040/mmedia; Traoré et al 2011). The varieties fall into two different categories: (i) the 'traditional' varieties (four of the six varieties), which have moderate to strong photoperiod sensitivity, a flexible crop-cycle length but smaller average yields; and (ii) the 'modern' varieties (two of the six varieties), which are short duration crops, insensitive to the photoperiod and selected to maximize the mean yield under optimal fertility conditions. Accumulated growing degree days (GDD) were used to estimate the duration of the different crop development stages, except for the duration of the photoperiod-sensitive stage, which depends on the astronomic day length. Details on model calibration and validation at local scale are given in the SI appendix (available at stacks.iop.org/ERL/8/014040/mmedia).
Since this study aims to provide a consistent, large-scale and spatially explicit assessment of climate change impacts on the crop yields of sorghum and millet in West Africa, we validated the model at the scale of West Africa. Following the approach of recent studies (Jones and Thornton 2003, Liu et al 2008) we used extensive simulations with the plot-scale process-based crop model SARRA-H version v.32 over a continental domain to derive such large-scale crop yields. The crop model SARRA-H was run for each of the 35 meteorological stations in West Africa over the 30-year (1961–90) time period and for each of the six cultivars. Since there are no existing data giving the proportion of each cultivar in the whole cropped area of sorghum and millet in West Africa, we assumed the same proportion of each cultivar in each site. We also made the assumption that soil and management practices were the same in the 35 locations. Although local variations of soils and management can have a major effect on crop yields, this assumption is possible because of the relative uniformity of the soil (over 95% of soils in this region are sandy with low levels of organic matter, total nitrogen, and effective cation exchange capacity: see Bationo et al 2005) and management practices (little or no agricultural inputs, no irrigation, sowing after the first major rain event: (Marteau et al 2011)). The available water holding capacity of the soil (between wilting point and field capacity) was set to 100 mm m−1 and the rooting depth was fixed at 1800 mm (see more details in the supplementary information section available at stacks.iop.org/ERL/8/014040/mmedia). Sowing date was generated by the model and defined as the day when simulated plant available water in soil was greater than 10 mm at the end of the day, followed by a 20 d period during which crop establishment was monitored (Marteau et al 2011). The juvenile stage of the crop was considered to have failed, triggering automatic re-sowing, if the simulated daily total biomass decreased during 11 out of 20 d. Simulations were performed without any irrigation since most crop systems are rainfed (93% of all agricultural land in Sub-Saharan Africa) and, to our knowledge, irrigation is never used for pearl millet and sorghum in West Africa. Although the model does not explicitly simulate the effects of fertilizer or manure application on crop yields, the impact of soil fertility was taken into account by tuning the biomass conversion ratio to an optimal level for modern varieties and to a lower level for traditional varieties that are usually cropped with low, to no, inputs. For millet, biomass conversion ratio is set to 4 for the modern variety (Souna) and 3.8 and 3 for the two traditional varieties (respectively HKP and Somno). We then scaled-up the crop yield prediction by simply averaging the crop yield of each of the 35 locations. The aggregation of local data in the scaling-up approach is a simple way of going beyond data heterogeneities and idiosyncratic details so that only the driving large-scale phenomena such as climate variability remain. Simulated crop yields were validated against Food and Agriculture Organization of the United Nations (FAO) statistics that are compiled annually from various agricultural production data submitted by its member nations. This is, to our knowledge, the only source available for long time series analysis of cross-national agricultural production. For West African countries, the FAO on-line database (http://faostat.fao.org/) contains annual agricultural statistics from 1961 to present. More details on validation methodology are given in SI appendix (available at stacks.iop.org/ERL/8/014040/mmedia).
2.2.2. Deriving future crop yields in response to climate change
To span the uncertainty associated with future climate change and its impact on crop yields in West Africa, we built a large virtual ensemble of climate scenarios. We defined 35 possible climate anomalies from May to September by combining precipitation anomalies from −20% to 20%, with a step of 10%, and temperatures anomalies from +0 to +6 °C, with a step of 1 °C based on the expected range of climate change in West Africa, as projected by GCMs within coordinated modelling exercises (CMIP3 and CMIP5; see section 2) to contribute to the Intergovernmental Panel on Climate Change assessment reports (IPCC AR4 and IPCC AR5). Following the 'delta' methods (Arnell et al 2003, Diaz-Nieto and Wilby 2005, Wilby et al 2004), we added this mean change in climate in the summer on to the daily station observations over the 1961–90 reference period; this created 35 future scenarios of daily climate. To obtain future temperatures, we added the same absolute anomaly to each daily value of mean, minimum and maximum temperature. The derivation of future rainfall was somewhat more complex, because either a change in the intensity of rainfall events, in the number of rain events, or in both, can lead to a rainfall anomaly. In the present study, we considered only changes in the intensity by simply rescaling the daily value of each rainfall station by the rainfall anomaly to generate possible future rainfall time series. An alternative method considering rainfall event frequency changes was used to adjust the number of the rainfall events to the projected anomalies. Comparisons are shown in the supplementary information for scenario −20% (figure S8 available at stacks.iop.org/ERL/8/014040/mmedia); scenario +20% depicts similar results. Finally, we used the 35 virtual climate scenarios to drive the SARRA-H crop model at each of the 35 locations across West Africa for sorghum and millet crops, each represented by three types of cultivars, that is a total of 7350 thirty-year simulations. The simulated yield for each considered variety and cultivar was then compared to the yield obtained by running the SARRA-H crop model with the data from the 1961–90 reference period.
3. Results
The simulated yield indices over the 35 weather station locations agreed well with the yield indices derived from statistics for each country available from FAO (figure 1(b)). Note that the term yield index refers to the standardized time series of crop yield. Averaging sorghum and millet yields, the inter-annual correlation coefficient between simulated and observed detrended yield indices is R = 0.70 (details per crop and per country are given in figure S1, trend equations are given in SI appendix available at stacks.iop.org/ERL/8/014040/mmedia). Compared to other crop impact studies at the continental scale (e.g. Berg et al 2010), SARRA-H shows improved simulation of crop yield variability in West Africa. Moreover, its skill is close to that shown by GLAM for groundnut in India, in our opinion, one of the best crop growth models for the tropics (Challinor et al 2004). However although our crop model could capture quite well the variability of crop yields, the mean yield (table S2 available at stacks.iop.org/ERL/8/014040/mmedia) was overestimated, by a factor two, which is a common shortfall in many crop model studies in Sub-Saharan Africa, because crop models are usually calibrated against data collected in controlled environments, and thus do not account for non-climatic factors like pests, weeds and soil-related constraints (Challinor et al 2004, 2005, Bondeau et al 2007). Despite this overestimation of the mean yield, the model accurately simulated the effect of changes in rainfall on crop yield anomalies (figure S3 available at stacks.iop.org/ERL/8/014040/mmedia).
The results presented in figure 2 show the effect of rainfall and temperature changes on mean crop yield (averaged across all varieties of sorghum and millet). We found that mean crop yields decreased in 31 of the 35 climate scenarios (figure 2) mainly as a response to temperature warming. When warming exceeded 2 °C, mean crop yields were always found to decrease significantly; rainfall changes being only able to modulate the magnitude of this negative impact. The worst case occurred when both heat and water stresses were combined. Based on the analysis of crop simulations we found that three key processes, and their interactions, accounted for the detrimental effect of temperature increase on crop yield. First the water stress was amplified with an increase of potential evapotranspiration (+8% for a 4 °C warming) in water-limited soils, where the crop roots could not take up more water. Second, the maintenance respiration per biomass unit increased dramatically (+30% for a 4 °C warming) and the biomass production consequently decreased. Third, the crop-cycle length was reduced (by up to 10 d for a 4 °C warming), which also resulted in reduced biomass production. As temperature is expected to increase in all IPCC climate change scenarios (table S3 available at stacks.iop.org/ERL/8/014040/mmedia), the negative impact on crop yields is a very robust result, especially for long-term projections (2071–90) in which warming over sub-Saharan West Africa is projected to exceed +2 °C in about 70% of the IPCC climate scenarios. Despite uncertainty in future rainfall changes, which are inconsistent across climate models and scenarios in CMIP3 simulations, and the projected increase of rainfall in CMIP5 simulations, the warming signal led to a yield reduction greater than 10% from the present-day value in nearly 50% of the climate medium-term projections (2031–50), and in more than 80% of long-term projections (figure 3). Future projections lie outside the domain of observed climate fluctuations over the past century (figure 2). Historical climate data from Climatic Research Unit (CRU) show important rainfall decadal fluctuations relative to the 1961–90 baseline: from +19% in the 1950s to −9% in the 1980s. These fluctuations led to major variations in the observed yield, which are well reproduced by the crop model (figure S3 available at stacks.iop.org/ERL/8/014040/mmedia). However, historical temperature variations, around a warming trend of about +1 °C since 1901, have remained moderate compared to the magnitude of the future warming signal projected by IPCC models. Given the dominant control by heat stress in all scenarios, future climate impacts on crop yields have no equivalents in historical conditions, for which the main controlling variable was rainfall variation. In all climate change scenarios, the projected yield decrease is modelled to be as severe as, or more severe than, during the record droughts of the 1970s and 1980s, which had dramatic consequences (Mellor and Gavian 1987).

Figure 2. The effect of rainfall and temperature changes on mean crop yield. Mean crop yield change (%) relative to the 1961–90 baseline for 7 temperatures (x-axis) and 5 rainfall (y-axis) scenarios. Results are shown as the average over the 35 stations across West Africa and the 6 cultivars of sorghum and millet. White triangles and circles are the projected anomalies computed by several CMIP3 GCMs and three IPCC emission scenarios (B1, A1B, A2) for 2071–90 and 2031–50, respectively. Projections from CMIP5 GCMs and three RCPs (4.5, 6.0 and 8.5) are represented by grey triangles and circles. Models and scenarios names are displayed in figure S2 (available at stacks.iop.org/ERL/8/014040/mmedia). Past observed climate anomalies from CRU data are also projected by computing 10-year averages (e.g. '1940' is for 1941–50). All mean yield changes are significant at a 5% level except boxes with a diagonal line.
Download figure:
Standard image
Figure 3. Historical and future mean yield changes. (a) Relative yield change probability in the 20th century derived from mean yearly climate (temperature and rainfall) anomalies according to CRU data. (b) Relative yield change probability for years 2031–50 according to GCM projections (both CMIP3 and CMIP5 simulations; see tables S2 and S3 (available at stacks.iop.org/ERL/8/014040/mmedia) for GCMs and scenario names). (c) Same as (b), but for 2071–90. All yield change values are averaged over the 35 stations across West Africa and the 6 cultivars of sorghum and millet.
Download figure:
Standard imageThe response of crop yields to climate change may vary strongly with variety and be region-dependent. First, when considering a warming of +4 °C (Thornton et al 2011), we found that the probability of a yield reduction higher than 10% was greater in the Sudanian region (southern Senegal, Mali, Burkina Faso, northern Togo and Benin), because of an exacerbated sensitivity to temperature changes compared to the Sahelian region (Niger, Mali, northern parts of Senegal and Burkina Faso), where crop yields are more sensitive to rainfall changes (figure 4(a)). In the Sahelian countries, future yield projections are more uncertain because of the inconsistency of rainfall changes among scenarios. Second, when looking at the specific response of each variety of sorghum and millet in our ensemble of simulations (table S1 available at stacks.iop.org/ERL/8/014040/mmedia), we found that traditional photosensitive varieties tend to be more resistant to the adverse effects of climate change (figure 4(b)). Although these traditional varieties have a lower present-day simulated yield compared to modern cultivars, their future yields are less affected by the projected temperature increase (table S1, figure S4 available at stacks.iop.org/ERL/8/014040/mmedia). Because traditional varieties of millet and sorghum calibrated in our study are photoperiod-sensitive, the duration of phenological phases depends not only on temperature and sums of GDD, but also on photoperiod (astronomic day length). Photoperiod of course remains constant while temperature is increasing (figure 5). As a result the crop-cycle length of traditional varieties is less reduced by the temperature increase than it is for the modern photoperiod-insensitive varieties. Biomass production is therefore less affected by the temperature increase (figure S5 available at stacks.iop.org/ERL/8/014040/mmedia). However, the impact of climate change remains negative for a +4 °C warming scenario whatever the variety. Furthermore, given the large difference in mean yields of the modern versus traditional varieties, the modern varieties still yield more under optimal fertility conditions in a warmer world (+4 °C) with 20% less rainfall based on the relative yield changes estimated in figure 4.
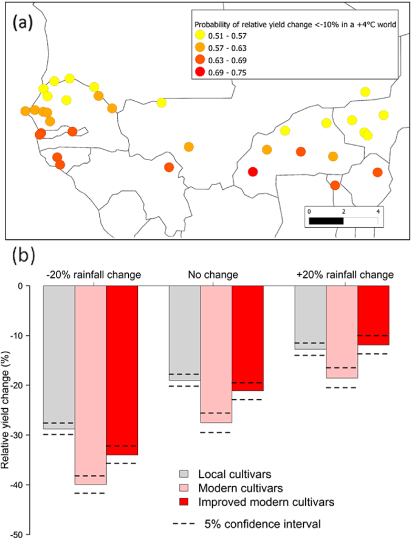
Figure 4. Mean yield change for +4 °C warming. (a) Probability of yield loss greater than 10% considering all rainfall scenarios. (b) Relative yield change (%) for a +4 °C warming and 3 rainfall scenarios for three types of cultivars: local photoperiod-sensitive cultivars (two varieties of sorghum and two varieties of millet), modern photoperiod-insensitive cultivars (one variety of sorghum and one variety of millet) and improved photoperiod insensitive modern cultivars (one variety of sorghum and one variety of millet) with higher thermal time requirements.
Download figure:
Standard image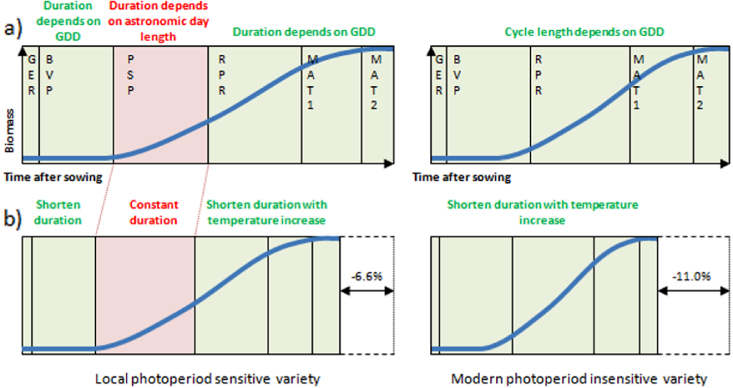
Figure 5. The effect of a +4 °C warming on crop-cycle length. (a) Schematic view of the different crop development stages simulated by the model SARRA-H for traditional variety, CSM 63 (left) and modern variety Kénikéba (right). The duration of germination (GER), basic vegetative phases (BVP), reproduction phase (RPR) and maturation phases (MATU1 and MATU2) depend on accumulated growing degree days (GDD). The duration of the photoperiod-sensitive phase (PSP) depends on the astronomic day length. (b) Reduction of crop-cycle length induced by a +4 °C warming. The duration of PSP remains constant as it does not depend on temperature. The values −6.6% and −11% refer respectively to relative change simulated for the CSM 63 variety and Kénikéba variety of sorghum.
Download figure:
Standard imageFinally we simulated the effects of an 'adaptation scenario', whereby in the future farmers systematically select photoperiod-insensitive varieties of millet and sorghum with a higher thermal time requirement under higher temperatures. To do so, we increased the modelled thermal time requirement of the basic vegetative phases of the two current varieties of millet and sorghum so that the length of their growth cycle remained the same under higher temperatures scenarios. This adaptation scenario clearly mitigates the effect of temperature increase and reduces crop yield losses due to a reduction of the crop-cycle length (figure 4(b)). However the traditional photoperiod-sensitive cultivars still minimize crop yield losses in the worst climate change scenario (+4 °C and 20% decrease of rainfall). Furthermore the crop yield of photoperiod-sensitive cultivars is less variable than that of modern varieties, irrespective of whether rainfall increases or decreases.
4. Discussions and conclusions
In our simulations, the major effect of climate change on the yields of millet and sorghum in West Africa was yield losses induced by higher temperature leading to increased potential evapotranspiration, crop maintenance respiration and a reduction of the crop-cycle length. Millet and sorghum yields are likely to decrease by some 0–41% in the 21st century over West Africa because of the expected warming, irrespective of whether rainfall increases or decreases. Although the different climate scenarios, time slices, crops and methodologies, hamper exact comparison to the results from other studies, this negative impact on crop yield is broadly consistent with previous findings for maize by Jones and Thornton (2003) and Schlenker and Lobell (2010). Based on a similar approach, but using the CERES crop model driven by climate projections from the HadCM2 climate model, Jones and Thornton (2003) projected an overall decrease of maize yield of −10% for Africa by 2050, with impacts varying between −30 and +2% over Sub-Saharan countries (−14% on average). This result suggests the primary role of temperature increase as the driver of maize yield change (Thornton et al 2009). With a completely different methodology based on empirical large-scale relationships between climate and yields, Schlenker and Lobell (2010) projected a yield decrease for mid-century (2046–65) of about −20% for C4 cereals, driven by the increase in temperature.
Although the size of this impact on yield is uncertain because of uncertainty in rainfall change projections, future climate and potential impacts will be very different from those observed in recent history because of the adverse role of temperature. Defining adaptation strategies for this unknown situation in West Africa is thus an unprecedented challenge. We must be able to identify the most vulnerable areas and to specify the crop varieties with the most robust characteristics for withstanding climate change. Here, our simulations have shown that the effect of climate change is not identical for all major grown cultivars of millet and sorghum. Crop yield losses are expected to be greater for modern cultivars with a high biological yield potential but a short, nearly fixed, growth cycle. Until recently, these varieties have been recommended as a way of intensifying cropping systems in West Africa (Dingkuhn et al 2006, De Rouw 2004). Traditional photoperiod-sensitive cultivars are less affected by temperature increase since the photoperiod limits the reduction of the crop duration. The effects of the shortening of crop-cycle duration could be partly counteracted by breeding varieties with higher thermal requirements but traditional photoperiod-sensitive cultivars will still present the advantage of lower yield variability and higher resistance to drought—factors reducing the relative advantage of modern cultivars. Furthermore, the high potential yield of modern varieties is only achieved under optimal fertility conditions which are rarely met in West Africa. In addition, photoperiod sensitivity would likely present some advantages in the event of future change in the timing of the rainy season. Indeed, it allows for flowering at the end of the rainy season for a wide range of planting dates and avoids incomplete grain filling, a problem for late maturing varieties faced with water shortage at the end of the rainy season (Dingkuhn et al 2006). Identifying such specific local crop characteristics is a key to developing a breeding strategy that addresses the trade-off between intensification and resilience to climate change (Dingkuhn et al 2006, De Rouw 2004).
Every modelling study has its limitations, and we recognize a few caveats to the design of our experiments. First, we only considered the effect of changes in mean temperature and rainfall, yet changes in variability such as heat-waves occurring during critical stages of crop development can also affect crop yield (Wheeler et al 2000) and floods from heavy rainfall may amplify the adverse effect of climate change. However, it is unlikely that the simulations from even the state-of-the-art GCMs we have used can give any robust prediction of such extreme events at local scale. Second, the crop simulations did not consider the effect of increased atmospheric CO2 concentration on crop yields. However, we should not expect the increased atmospheric CO2 concentration to offset the adverse effect of temperature increase on millet and sorghum yields, because they are both C4 plants. Photosynthesis rates for C4 plants do not respond strongly to higher ambient CO2, although water stress resistance can be slightly improved as a result of lower stomatal conductance and greater intercellular CO2 concentration (Leakey 2009, Long et al 2006a, 2006b). Indeed, comparison between crop simulations where CO2 is increasing, or is kept constant in the future, shows very little difference amongst millet yield changes in Africa under several climate change scenarios (Berg et al 2013). Finally, our simulations considered only one representative soil for the entire Sudanian and Sahelian savanna, while in reality soil properties might vary across the region. Indeed, rainfed millet and sorghum are often grown along toposequences with differences in elevation of a few metres. This natural rainfall harvesting can lead to differentiation in soil properties and hydrological conditions, which in turn may affect crop performance and yield.
In summary, we have attempted to perform a consistent assessment of climate change impacts on crop yields in West Africa by accounting for uncertainties in future climate scenarios. The adverse role of higher temperature on crop yield is a robust result, irrespective of rainfall changes, and seems to be modulated across millet and sorghum varieties and across regions in West Africa. This points to the need for further work on identifying varieties that are more resilient to elevated mean temperature during the growing period.
Acknowledgments
This work has been funded by REGYNA (GIS-CES), the French National Research Agency (ANR) through the ESCAPE project (ANR-10-CEPL-005) and the R2DS network.