Article

Combining Field and Laboratory Measurements to Determine the Erosion Risk of Cohesive Sediments Best

1
Institute for Modelling Hydraulic and Environmental Systems, University of Stuttgart, Pfaffenwaldring 61, Stuttgart 70550, Germany
2
Federal Institute of Hydrology, Am Mainzer Tor 1, Koblenz 56068, Germany
*
Author to whom correspondence should be addressed.
Water 2015, 7(9), 5061-5077; https://doi.org/10.3390/w7095061
Submission received: 30 June 2015 / Revised: 20 August 2015 / Accepted: 24 August 2015 / Published: 18 September 2015
(This article belongs to the Special Issue Recent Advances in Riverflow Research)

Abstract

:
In contrast to non-cohesive sediments, the incipient motion of cohesive sediments is characterized by much more complex interactions between several sedimentary, biological, and chemical parameters. Thus, site-specific investigations are required to obtain information about the erosion stability of cohesive materials. This becomes even more relevant for contaminated sediments, stored in riverine sediments as a “burden of the past”, because of their remobilization potential during flood events. This article represents a twofold measuring strategy for the detection of erosion thresholds: an in situ device for determination of critical shear stresses in the field, and a laboratory approach where sediment cores are withdrawn and subsequently analyzed over depth. The combined measuring strategy was applied in the River Elbe and at selected sites of the catchment of the River Saale. The results show a great variety of erosion thresholds over depth, demonstrating the need to conduct vertical analyses, especially when addressing buried layers with contaminations. The latter is only possible in the laboratory but the in situ device revealed clear benefits in capturing the loose flocculent layer on top of the sediment that might be easily lost during sediment retrieval and transport. Consequently, it is ideal to combine both approaches for a comprehensive insight into sediment stability.

1. Introduction

Since long, the dynamic equilibrium between the erosion, transport, deposition and consolidation of fine sediments (ETDC cycle) has received great attention in engineering science, by stakeholders and public domains. Quantity issues of sediment dynamics concern morphological aspects along with prevailing hydraulics to affect the aquatic habitats as well as the maintenance of flood control, navigable waterways and harbors as well as, eventually, coastal protection. Quality issues relate to nutrients and hydrophobic pollutants associated with fine sediments to influence water quality, freshwater ecosystem services, human-health and management options such as dredging or dumping sediments [1,2]. Recently, there has been an agreement that both quantity and quality issues need to be addressed in order to reach the aims of the European Water Framework Directive [3]. The first step is to get a profound understanding on fine sediment dynamics since potentially associated compounds couple their fate closely to this ETDC cycle. However, the behavior of small particles is largely unpredictable due to complex interactions between the sediments, hydraulics, and biology [4,5]. Despite intensive research efforts reflected in various European or international projects and networks, a general formula of the incipient motion of fine sediments is not available. Hence, up to now, the sediment stability has to be determined at the sites of interest, whether this happens on site or within the laboratory using (ideally) undisturbed sediment samples.
Therefore, different laboratory and in situ devices have been developed to measure the critical shear stresses and/or erosion rates (e.g., [6,7,8,9,10,11,12,13]). For the large majority of these erosion devices, determination of fine sediment stability is restricted to the surface layer. However, once the surface layer has been eroded, the underlying sediment layers vary extremely in stability and consolidation depending on a magnitude of influencing parameters such as particle sizes, water content, cation exchange capacity, organic substances (dead or alive), and microbially secreted polymeric substances [14]. The erosional behavior of these deeper sediments is of particular interest since many hydrophobic anthropogenic pollutants, which preferentially bind to small particles and originate from the peak-inputs around 30 years ago, are immobilized in these long-deposited layers (“legacy of the past” [15]). Increased hydraulic forces such as floods or dredging activities might remobilize these old burdens to become bioavailable and toxic again [16,17]. The latter has become sad reality with huge ecological and economic aftermaths e.g., during the floods in 2002 and 2014 in the East part of Germany [18,19,20]. The present investigations are reasoned by the aim to better judge on sites of high contamination risk in order to take necessary precautions and initiate countermeasures.
At the Institute for Modelling Hydraulic and Environmental Systems (IWS) of the University Stuttgart, a straight erosion flume (“Strömungskanal zur Ermittlung der tiefenabhängigen Erosionsstabilität von Gewässersedimenten”, SETEG) combined with Sediment Erosion Rate Detection by Computerized Image Analysis (SEDCIA) has been established and continuously developed further to determine sediment stability over depths up to 1.5 m [10] as well as erosion rates of suspended material and bed load, respectively [21]. These laboratory methods are complemented by in situ measurements of sediment stability to account for possible discrepancies between field and laboratory values due to sediment withdrawal or transportation [22]. For this reason, the IWS developed a benthic flow-through flume [23]. Thus, the IWS realized a twofold strategy for a sophisticated sediment erosion risk assessment: an in situ device for determination of critical shear stresses directly in the field, and a laboratory approach where sediment cores are withdrawn and subsequently analyzed over depth in a straight erosion flume.
The present paper aims at focusing on data recently obtained from two field studies in the River Elbe and in the catchment of the River Saale (both Germany) to determine the erosion risk of highly contaminated cohesive depositions. Results are discussed particularly regarding the chances and drawbacks of the laboratory and in situ analyzing techniques.

2. Study Areas

The River Elbe is the third largest river in Europe flowing from the Czech Republic through central and northern Germany before discharging into the North Sea. The River Saale is one of the major tributaries to the River Elbe and originates in the German federal state of Bavaria with the majority of the catchment area in the states of Saxony, Thuringia, and Saxony-Anhalt. The study areas include several groyne fields of the River Elbe between river kilometer 432 and 510 and selected sites in the catchment of the River Saale. All study areas are heavily affected by anthropogenic contaminants released in the past by the local chemical industry. The so-called “Middle German Chemical Triangle” is the central region of three main industrial areas (Leuna-Buna-Bitterfeld) that emitted hazardous substances over decades into the hydrosphere of River Elbe and Saale; predominantly before 1990 [24]. Given the high affinity of hydrophobic pollutants to fine sediments in surface waters, substantial amounts of sediments associated with contaminants have been deposited to accumulate in both Rivers Elbe and Saale.
Although the input of persistent contaminants could be significantly reduced mainly by the former GDR industry demise, significant amounts of heavy metals and chlorinated hydrocarbons are still present in both rivers’ hydrosystems. To obtain information about the erosion risk of those contaminated depositions, extensive measuring campaigns were conducted in both river catchments. In the River Elbe, six groyne fields with five sample locations each were investigated in 2012 downstream of the city of Magdeburg. Three groyne fields are situated between river kilometer 432.2 and 436.2 while the other three groyne fields are located further downstream between river kilometer 504.8 and 509.4. In the River Saale fifteen sites were probed in 2012 encompassing areas adjacent and within the river, as well as several tributaries with different flow characteristics (backwater, impoundments, free flowing sections).

3. Materials and Methods

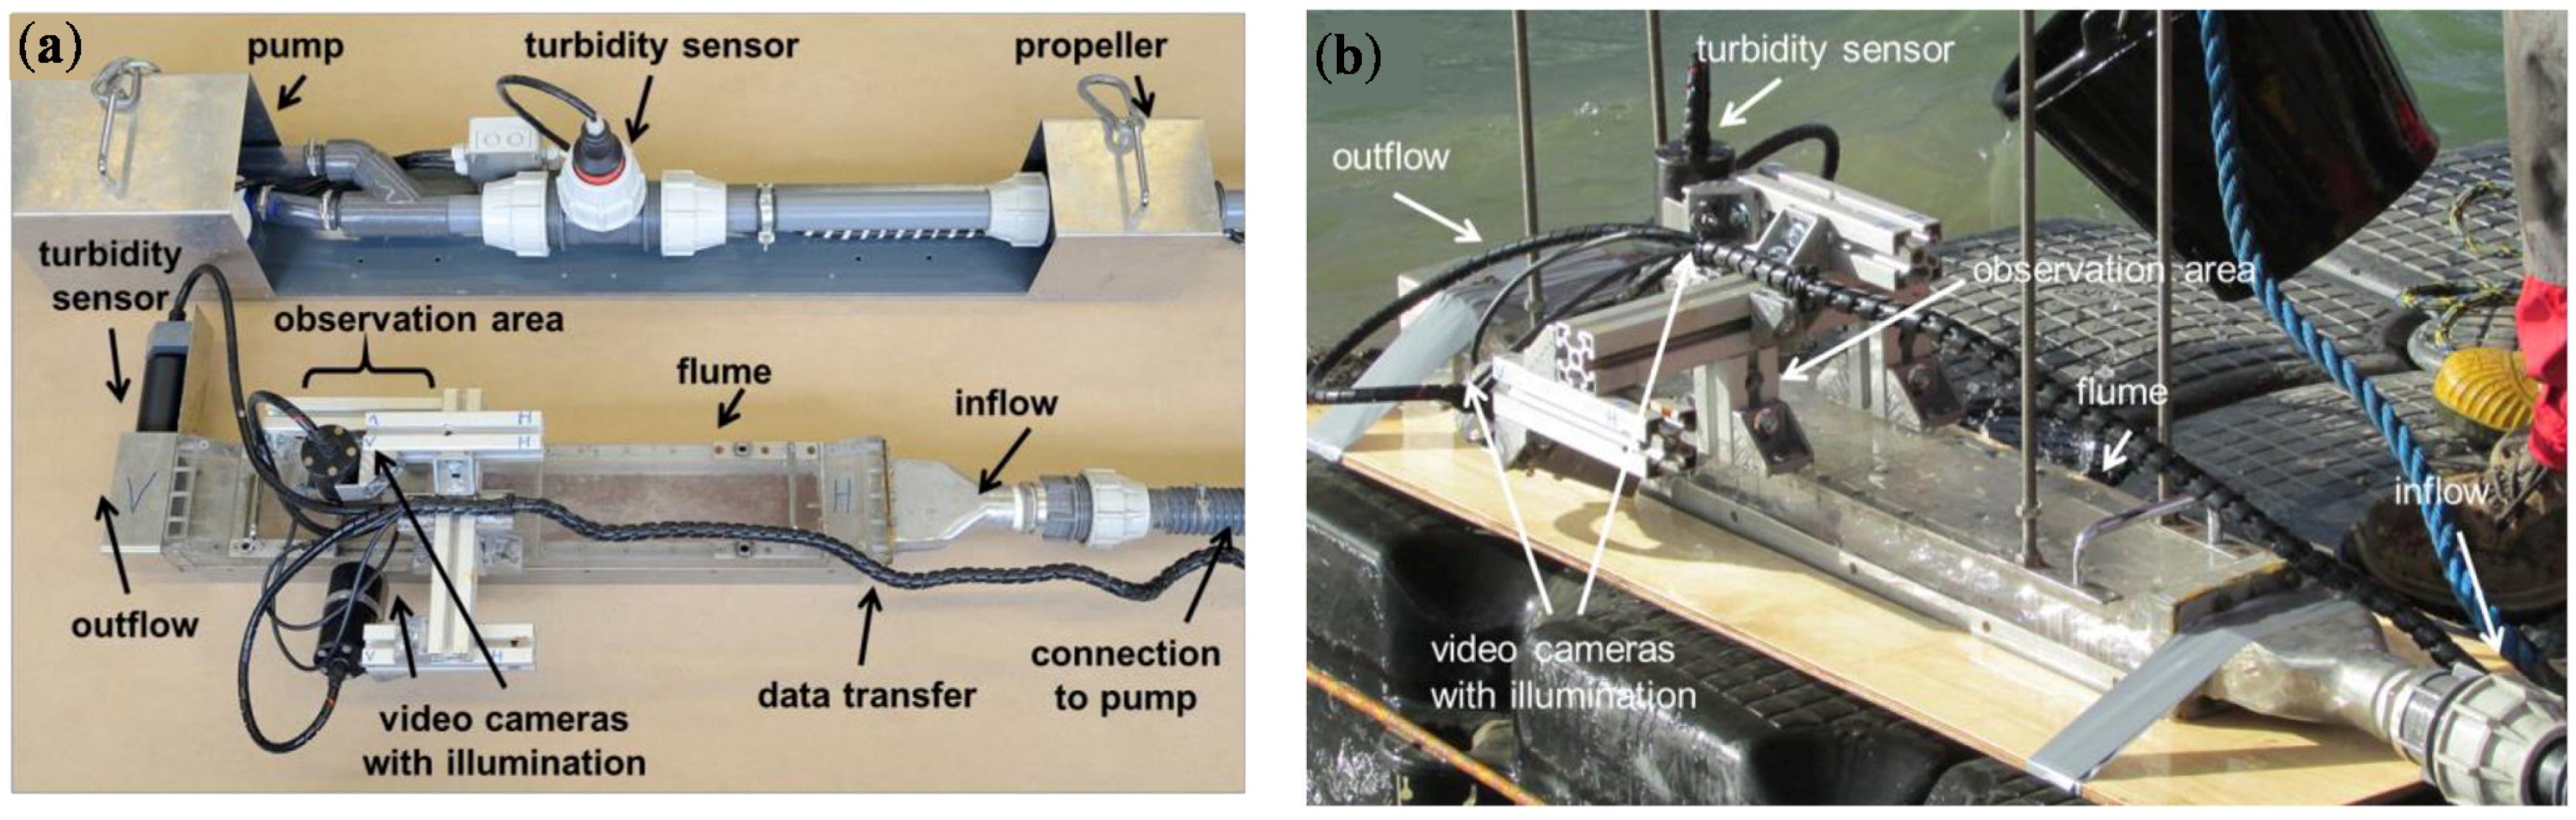
3.1. In Situ Erosion Device

To investigate cohesive sediment dynamics, various types of in situ instruments exist that can be mainly classified in recirculating flumes and straight flow-through flumes [25]. The in situ device of the IWS is based on the flow-through technique with an open bottom and consists of a rectangular flume made of acrylic glass (length 110 cm, width 10 cm, height 5 cm [23]). The flume is placed carefully onto the sediment surface of the river bed and an adjustable pump directs pressurized water through the flume. The chosen geometry of the flume enables a fully developed flow, which is verified by previous measurements of Reynolds’ shear stresses with a Laser-Doppler-Anemometer (LDA). The illuminated observation area, located 70 cm behind the inflow, is monitored by two underwater video cameras. An inline fitting with paddle wheel indicates the local flow velocity. Turbidity sensors are located at the in- and outflow section of the flume to allow the quantification of the resuspended particles during the erosion experiments. The incipient motion of sediments is then detected by steadily increasing the flow and simultaneous monitoring of the observation area. The cameras are directly connected to a laptop transferring the data on the failure and transport behavior of cohesive sediments. To get reliable information about the critical shear stress, these measurements are repeated four to five times at each site location while repositioning the in situ device carefully. Figure 1 shows a photograph of the in situ device in the laboratory (a) and in the field (b).
Figure 1. In situ device to determine critical bottom shear stresses at the sediment surface with submersible pump in the laboratory (a) and in the field with submerged pump (b).
Water 07 05061 g001

3.2. Withdrawal of Sediment Cores in the Field

Cylindrical plastic tubes are used to withdraw sediment cores from the field to examine their sedimentary characteristics in the laboratory. The tubes have a diameter of 13.5 cm to minimize edge effects and a length of 120 cm to enable depth-dependent analyses while the choice of transparent plastics allows for optical measurements. For sediment withdrawal, the cylindrical cores are carefully inserted into the sediment down to the aimed depth and slowly retrieved while under pressure ensures full core retention and thus, original layering. Thereby, a level of natural water of at least 10 cm remains on top of the core since this is important to minimize disturbance effects on the sediment surface via dehydration or during the following transport. The tubes containing the sediment are then tightly closed by a lid avoiding the development of air bubbles. In the laboratory, the cores are briefly stored in a dark cooling room until immediate analysis.

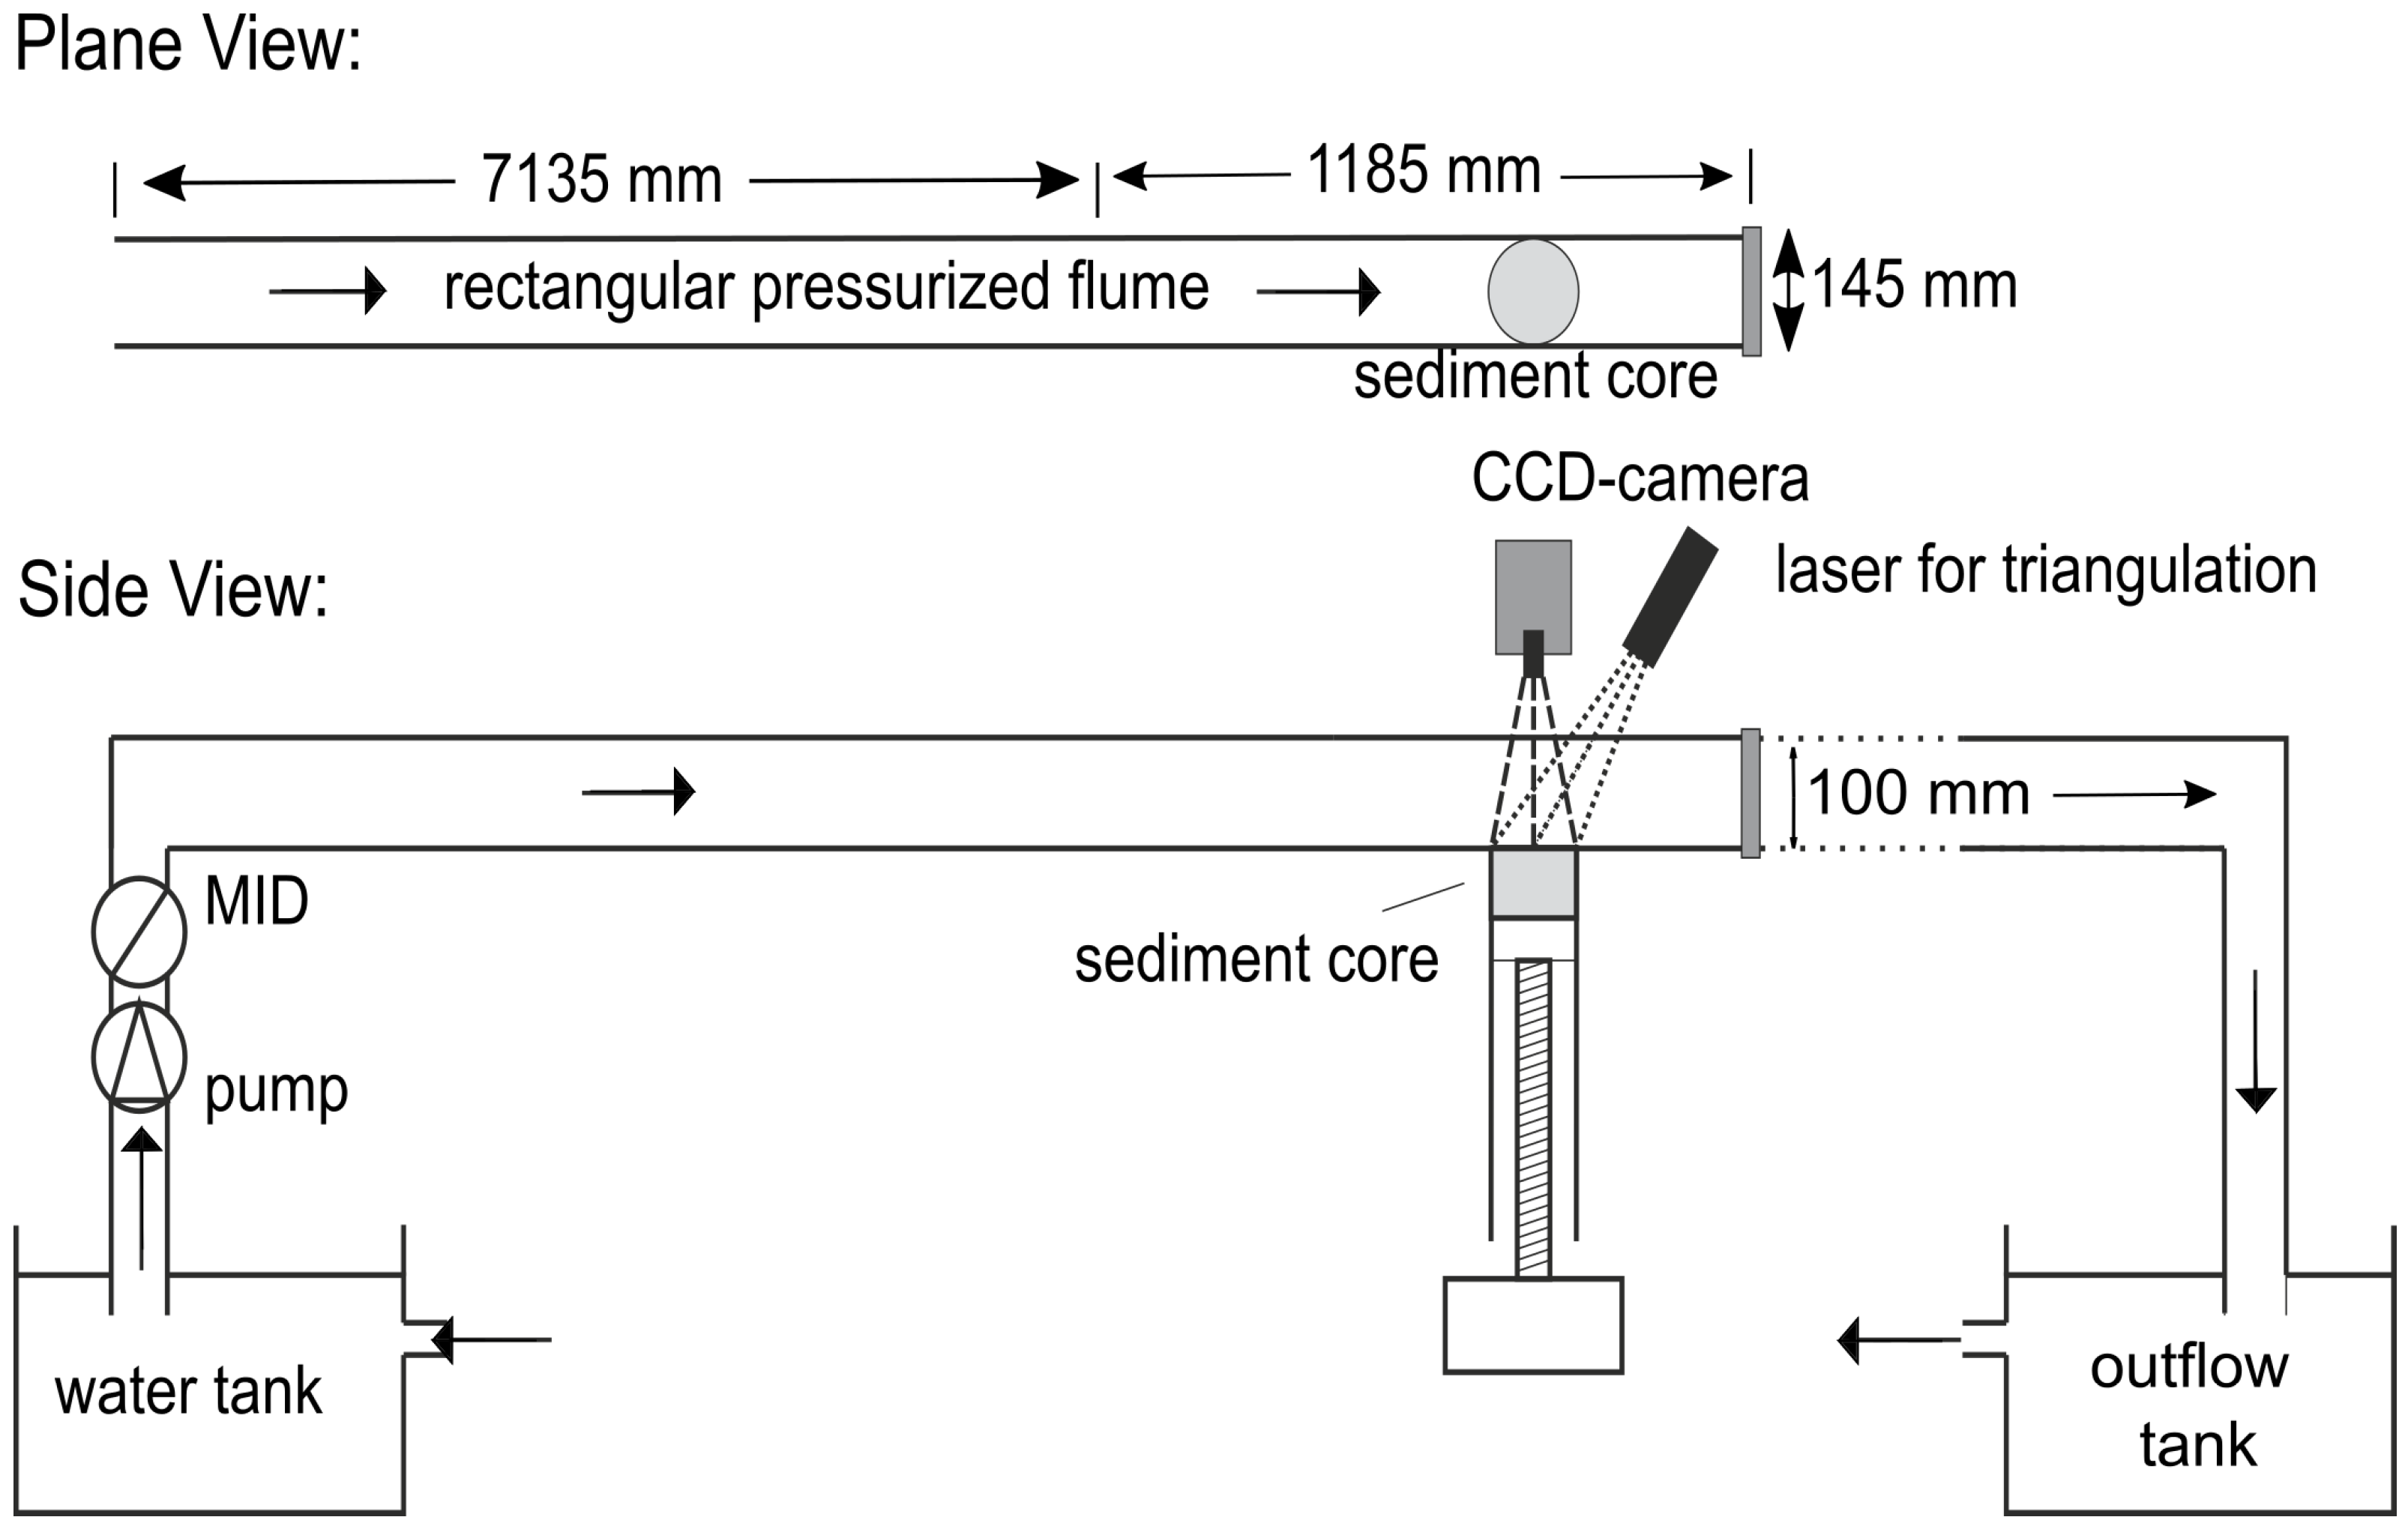
3.3. The SETEG Flume and the SEDCIA System

To assess the erosion risk of cohesive sediments, the critical shear stress for incipient motion as well as erosion rates are determined using the SETEG flume and the SEDCIA system, respectively [10,21]. The flume consists of a pressurized rectangular flume (length 8.32 m, width 0.145 m, height 0.10 m) in which the layers of the cylindrical sediment core (13.5 cm in diameter) are subsequently exposed to the flow within. Thereby, the cores are inserted from below and moved up stepwise by a jack stepping motor until the core surface is plane with the flume bottom. Then, the adjustable discharge is increased continuously until entrainment of sediment particles from the sediment surface can be observed. The resulting critical shear stress is determined by a hydraulic calibration function (Q-τ-relation), which is obtained by previous high-resolution LDA measurements. For vertical profiles, the measurements are conducted at depth intervals of 1.0 to 5.0 cm.
For shear stresses higher than the critical ones (τ > τcr) erosion rates are determined applying an advanced version of the SEDCIA-system [21]. The system consists of a laser that projects 30 laser lines onto the sediment surface. Those laser lines are continuously photographed by a CCD-camera during the erosion experiments. Using computer-assisted image-analyses of subsequent snapshots, the sediment surface can be recalculated by a bilinear interpolation algorithm. Considering the time interval between the two photographs the eroded volume loss is determined in relation to time. Knowing the density of the eroded material, the erosion rate is calculated as mass per unit area and unit time. Hence, the system accounts for both suspended load and bed load in contrast to other approaches that estimate the erosion rate solely by changes of the suspended load [26]. Figure 2 shows a schematic overview of the SETEG- and SEDCIA-system.
Figure 2. Schematic overview of the SETEG- and SEDCIA-system to measure depth-dependent critical shear stresses and erosion rates in the laboratory [10,21].
Water 07 05061 g002

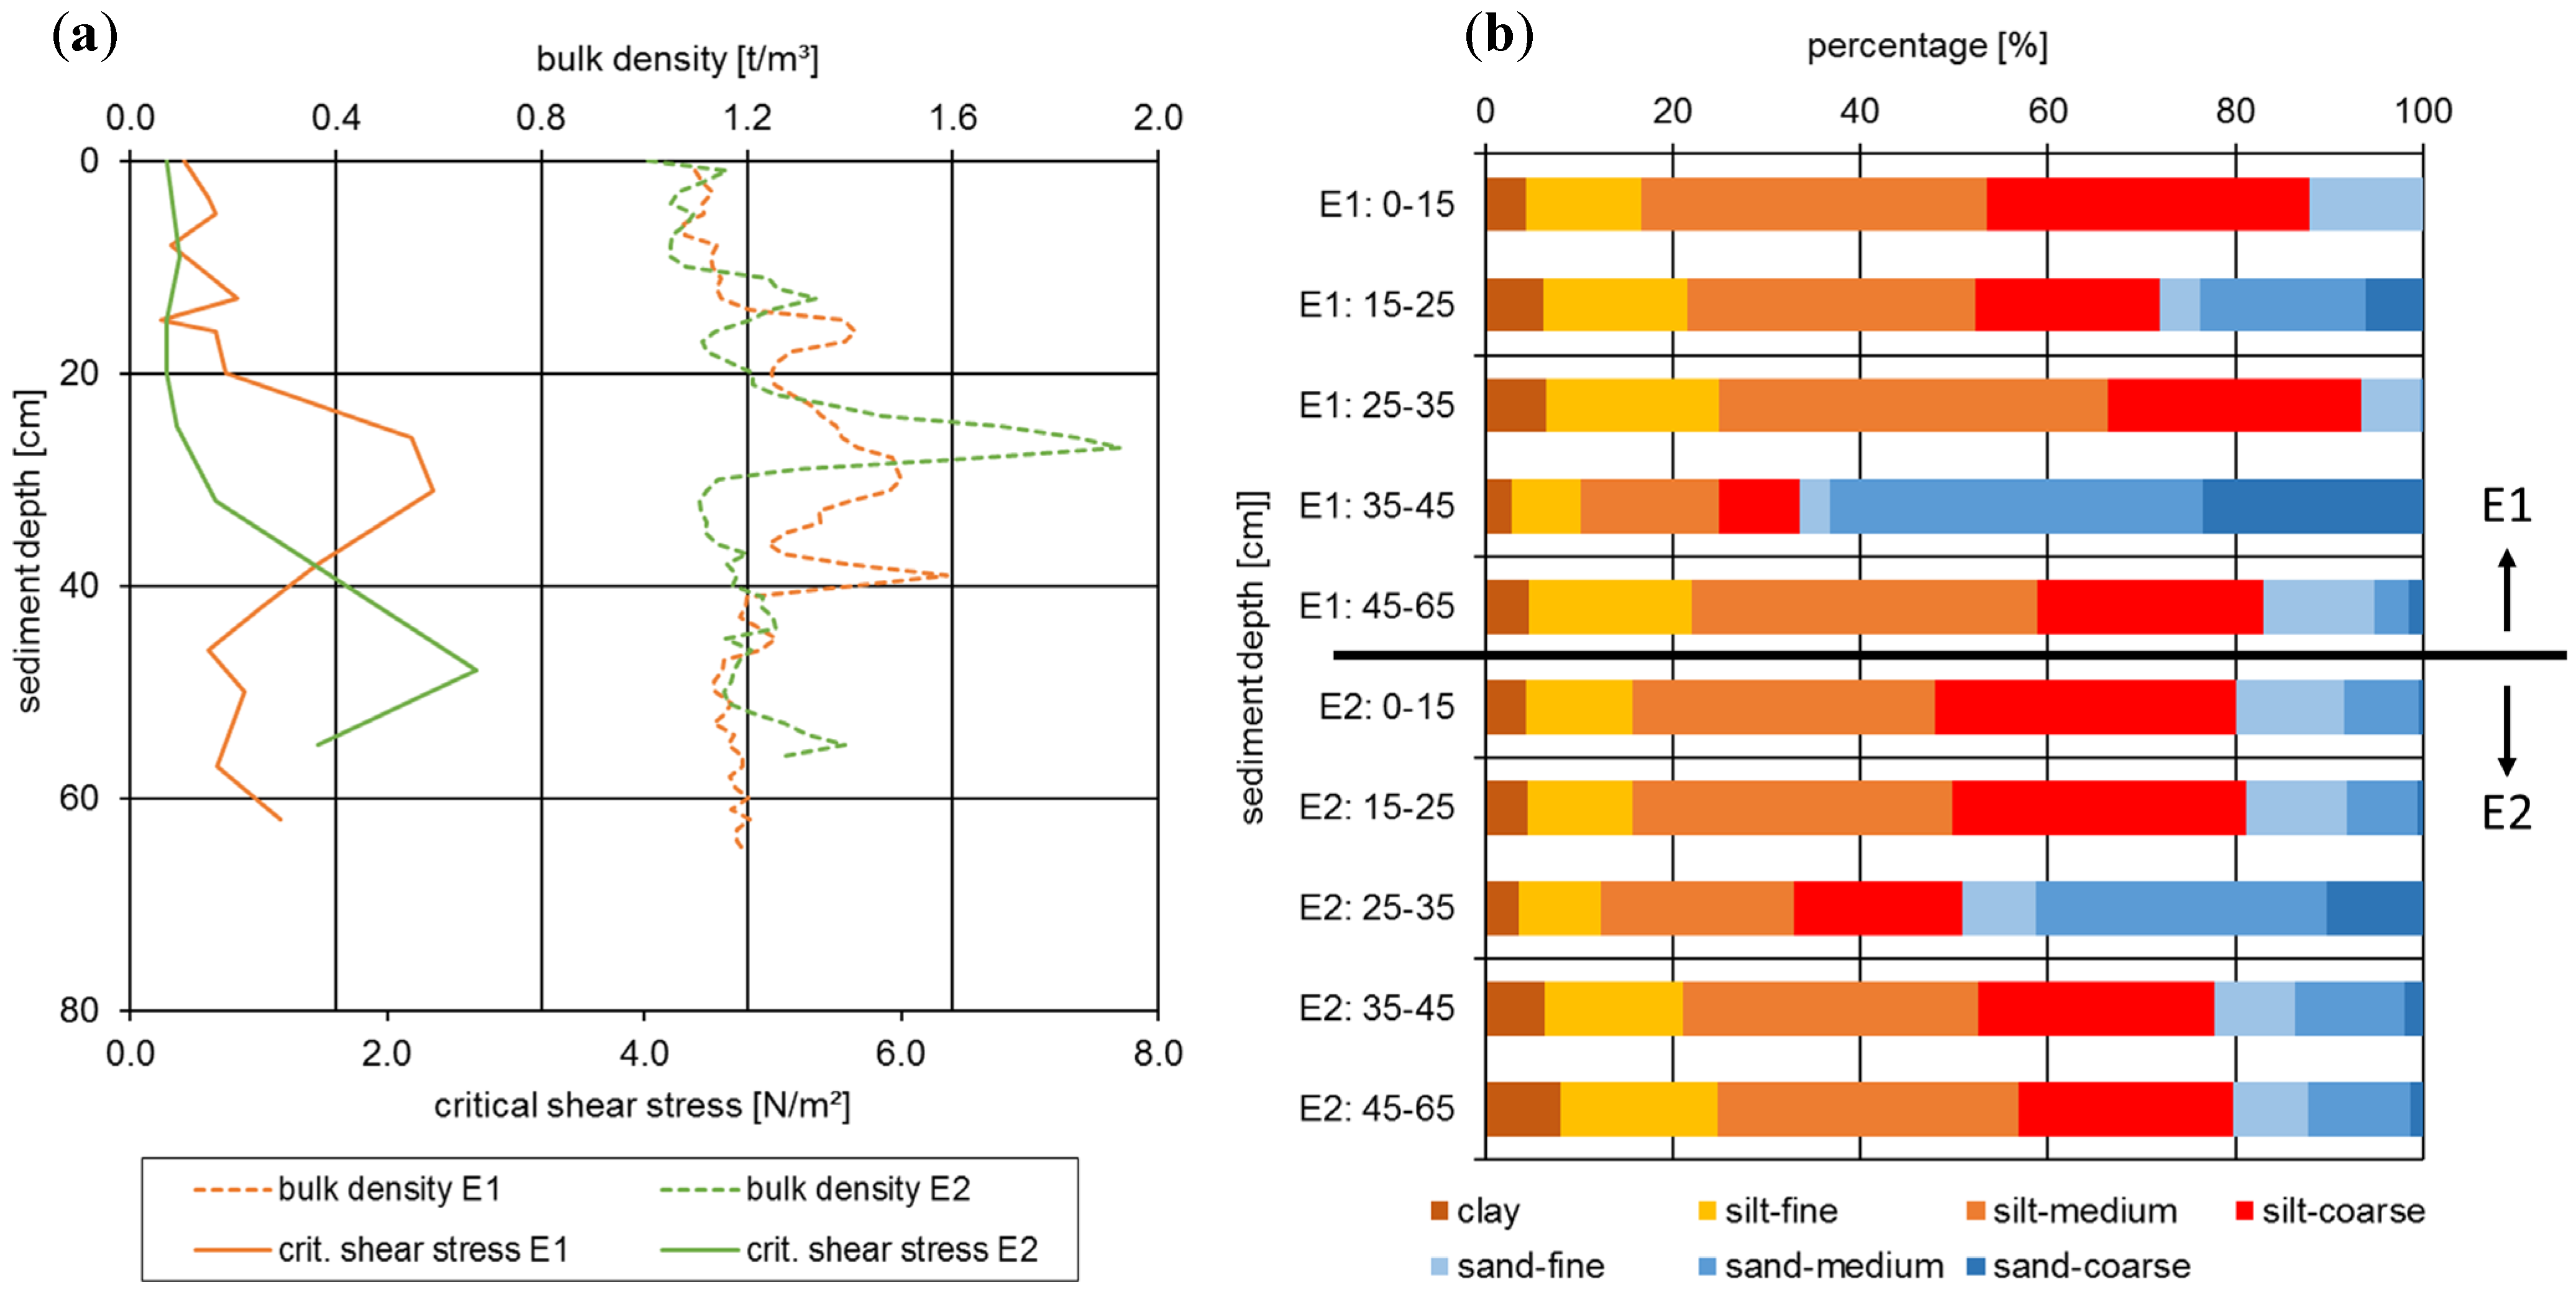
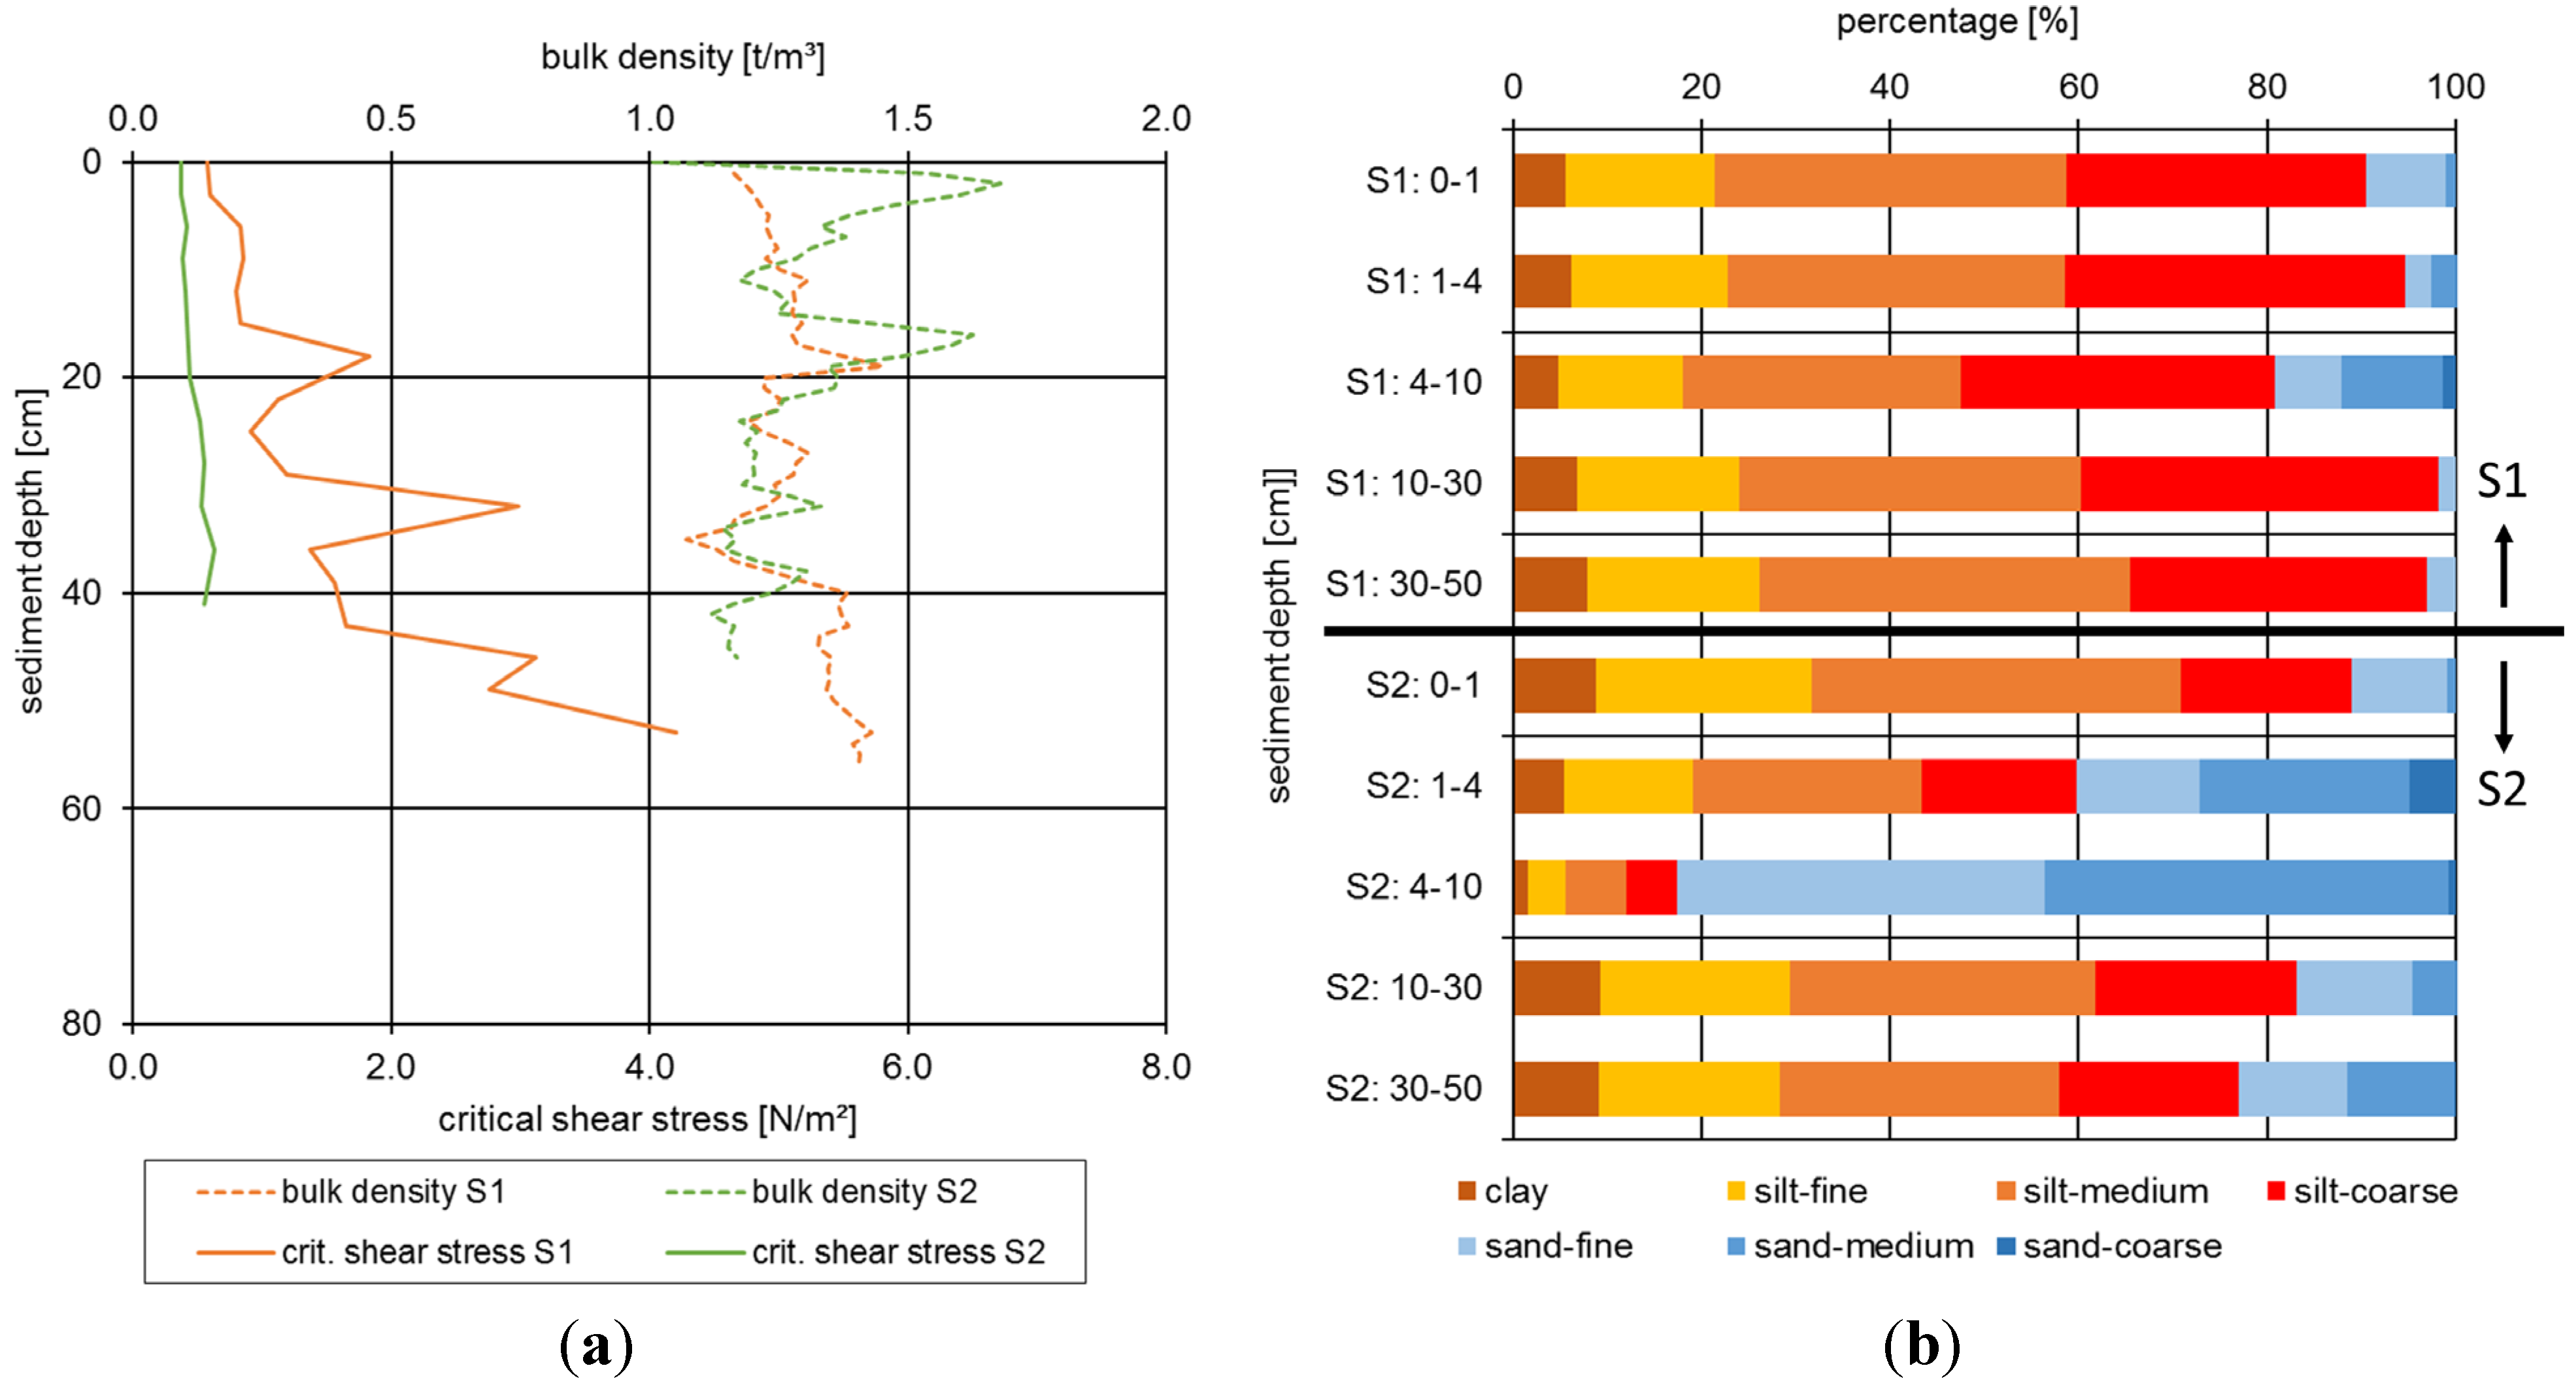
3.4. Bulk Density and Particle Size Distribution

To obtain information about the pore volume and the consolidation status that both potentially influence the erosion stability of cohesive sediments, e.g., [27], the bulk density of each sediment core is measured by applying a non-destructive gamma-ray-densitometer [28]. For this purpose, the gamma-ray densitometer is mounted on a vertical transversal unit, which automatically moves the device along the core to obtain a high-resolution vertical profile in steps of 1 cm. The attenuation of gamma-rays (Cs137) is detected to derive the bulk density after a careful calibration of the densitometer regarding the exposed materials and the core diameter.
The particle size distribution is another sedimentary attribute strongly influencing the incipient motion and erosion mass of cohesive sediments e.g., [29]. To obtain information about the particle size classes, three subsamples of about 200 g–300 g are extracted from several predefined sediment layers to be analyzed by a laser diffraction device (Type: Mastersizer 2000, Malvern Instruments Ltd, Malvern, UK). In total, 57 different particle size classes in a range of 0.30 μm to 1000 μm are evaluated which are integrated into seven final particle size classes ranging from clay to coarse sand. Table 1 shows this final particle size classification.
Table 1. Classification of particle sizes for the sediment samples of River Elbe and River Saale.
ClayFine SiltMedium SiltCoarse SiltFine SandMedium SandCoarse Sand
<2 μm2–6 μm6–20 μm20–64 μm64–200 μm200–640 μm>640 μm

4. Results

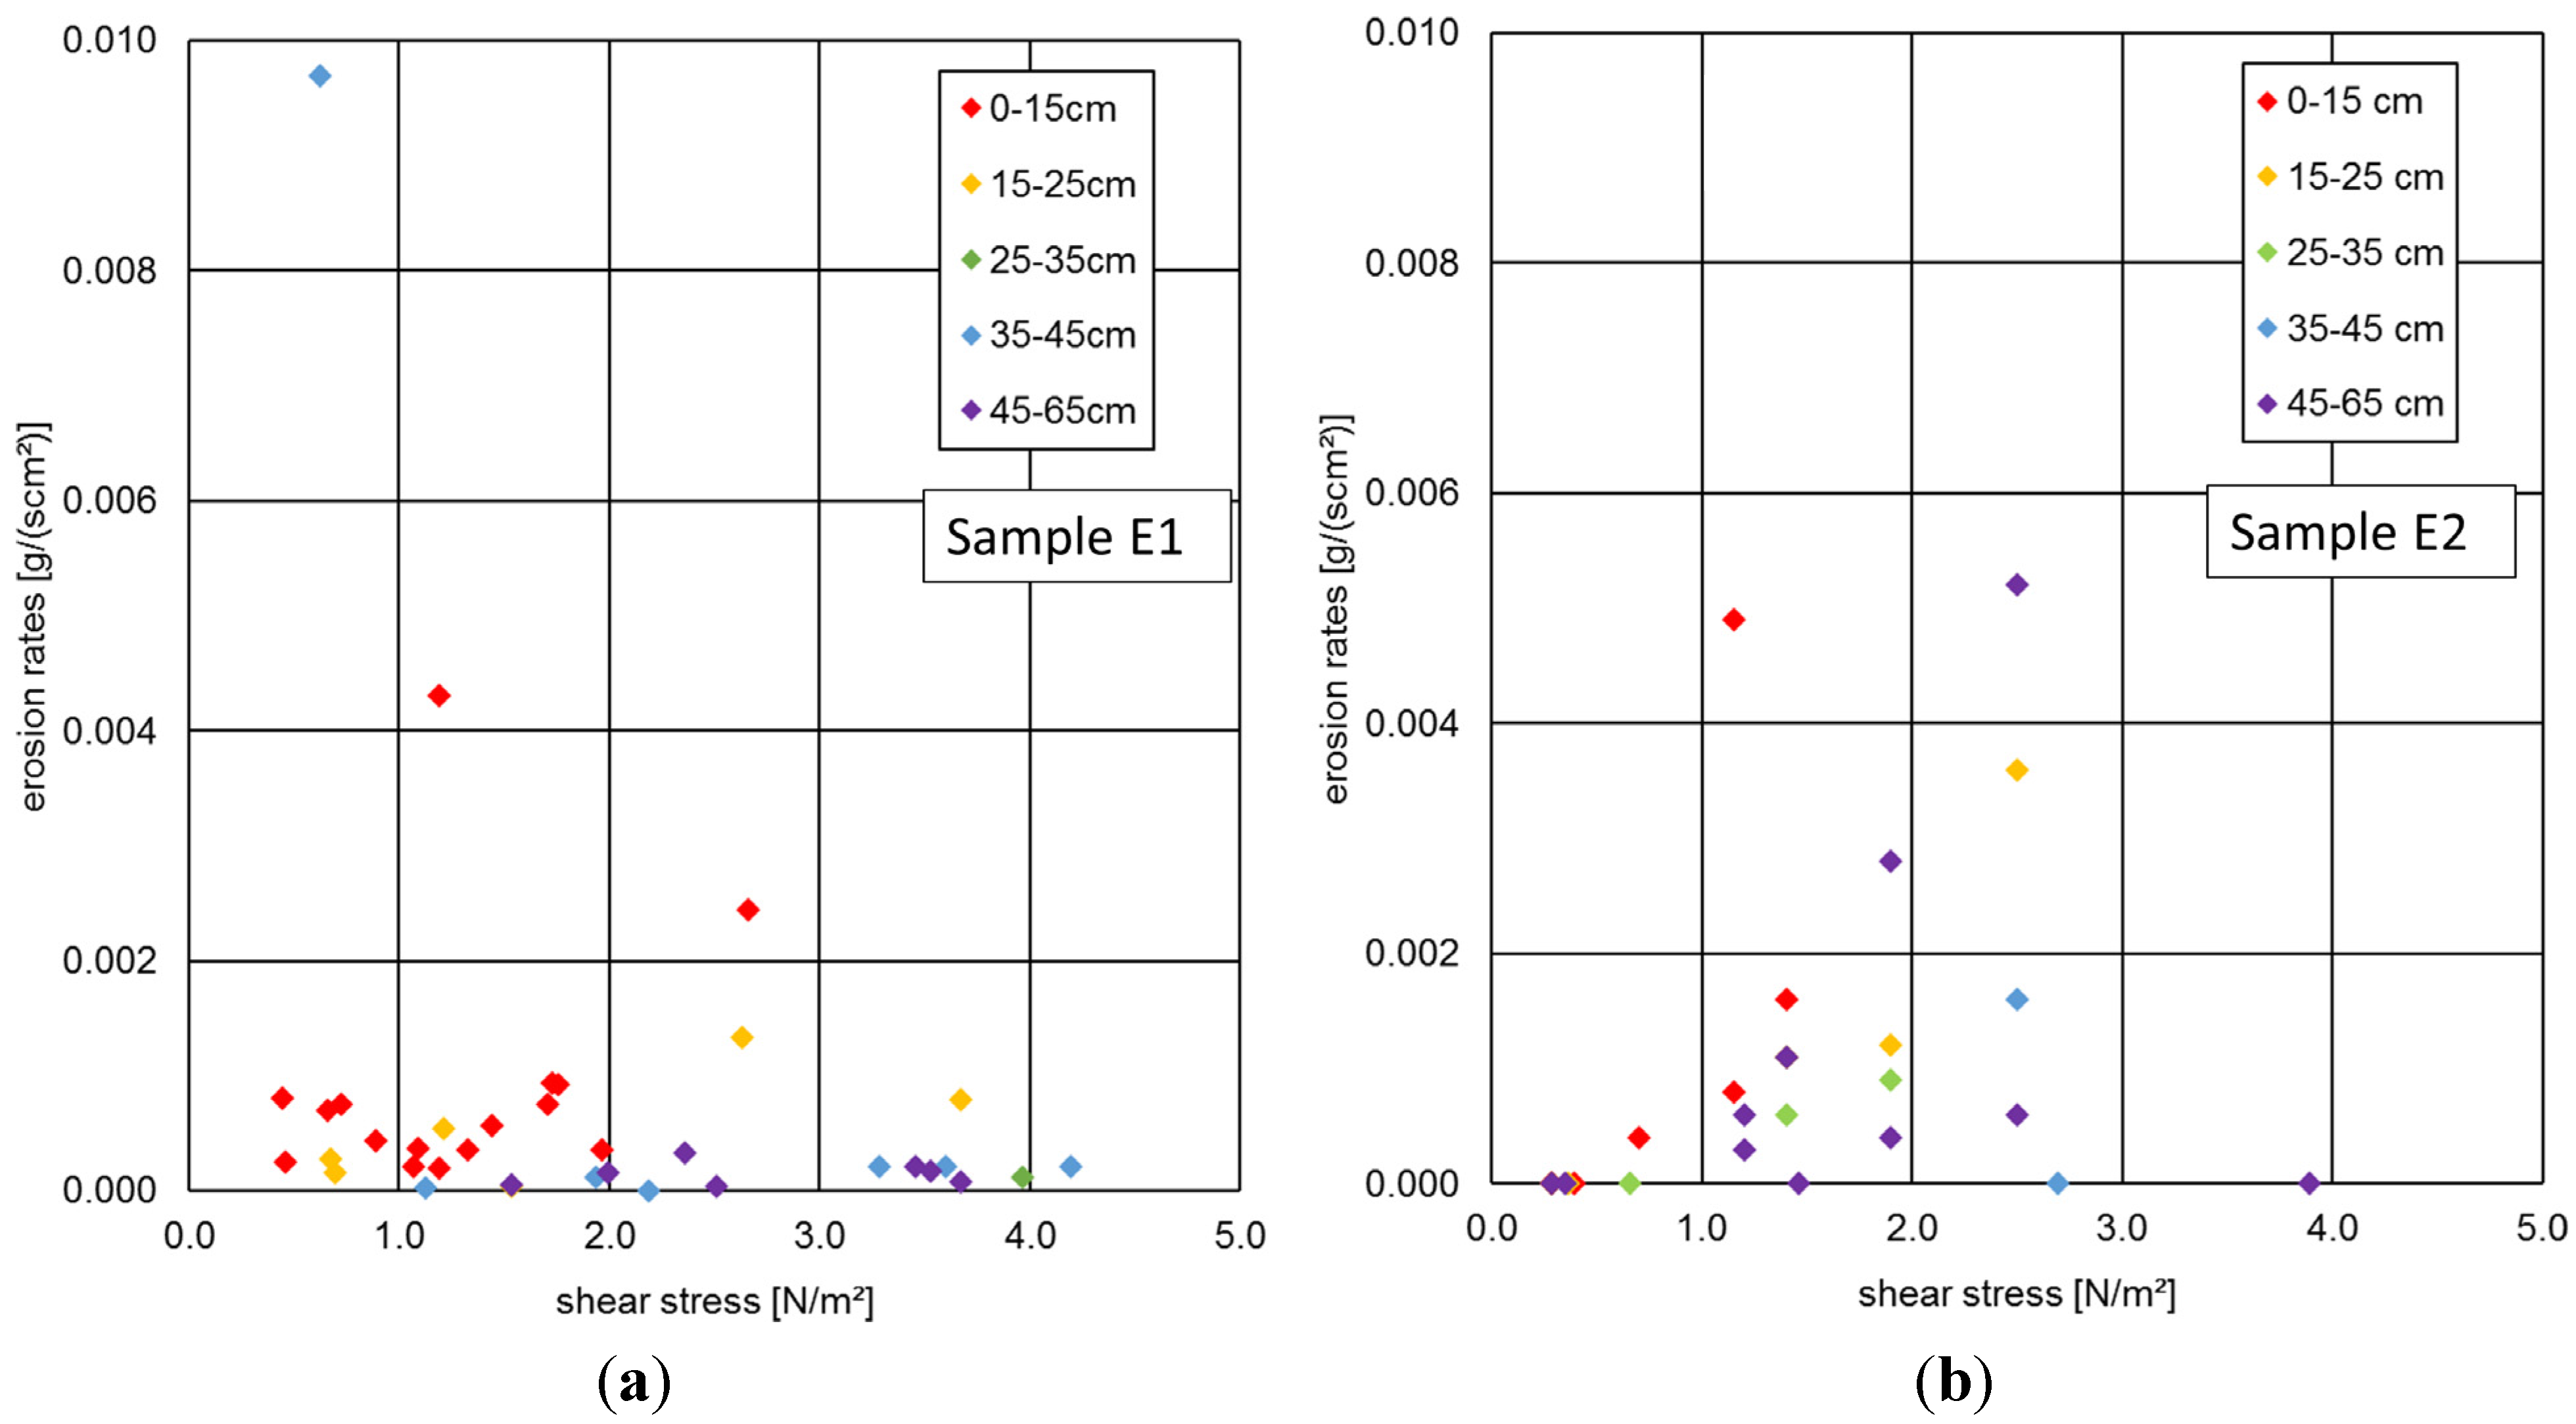
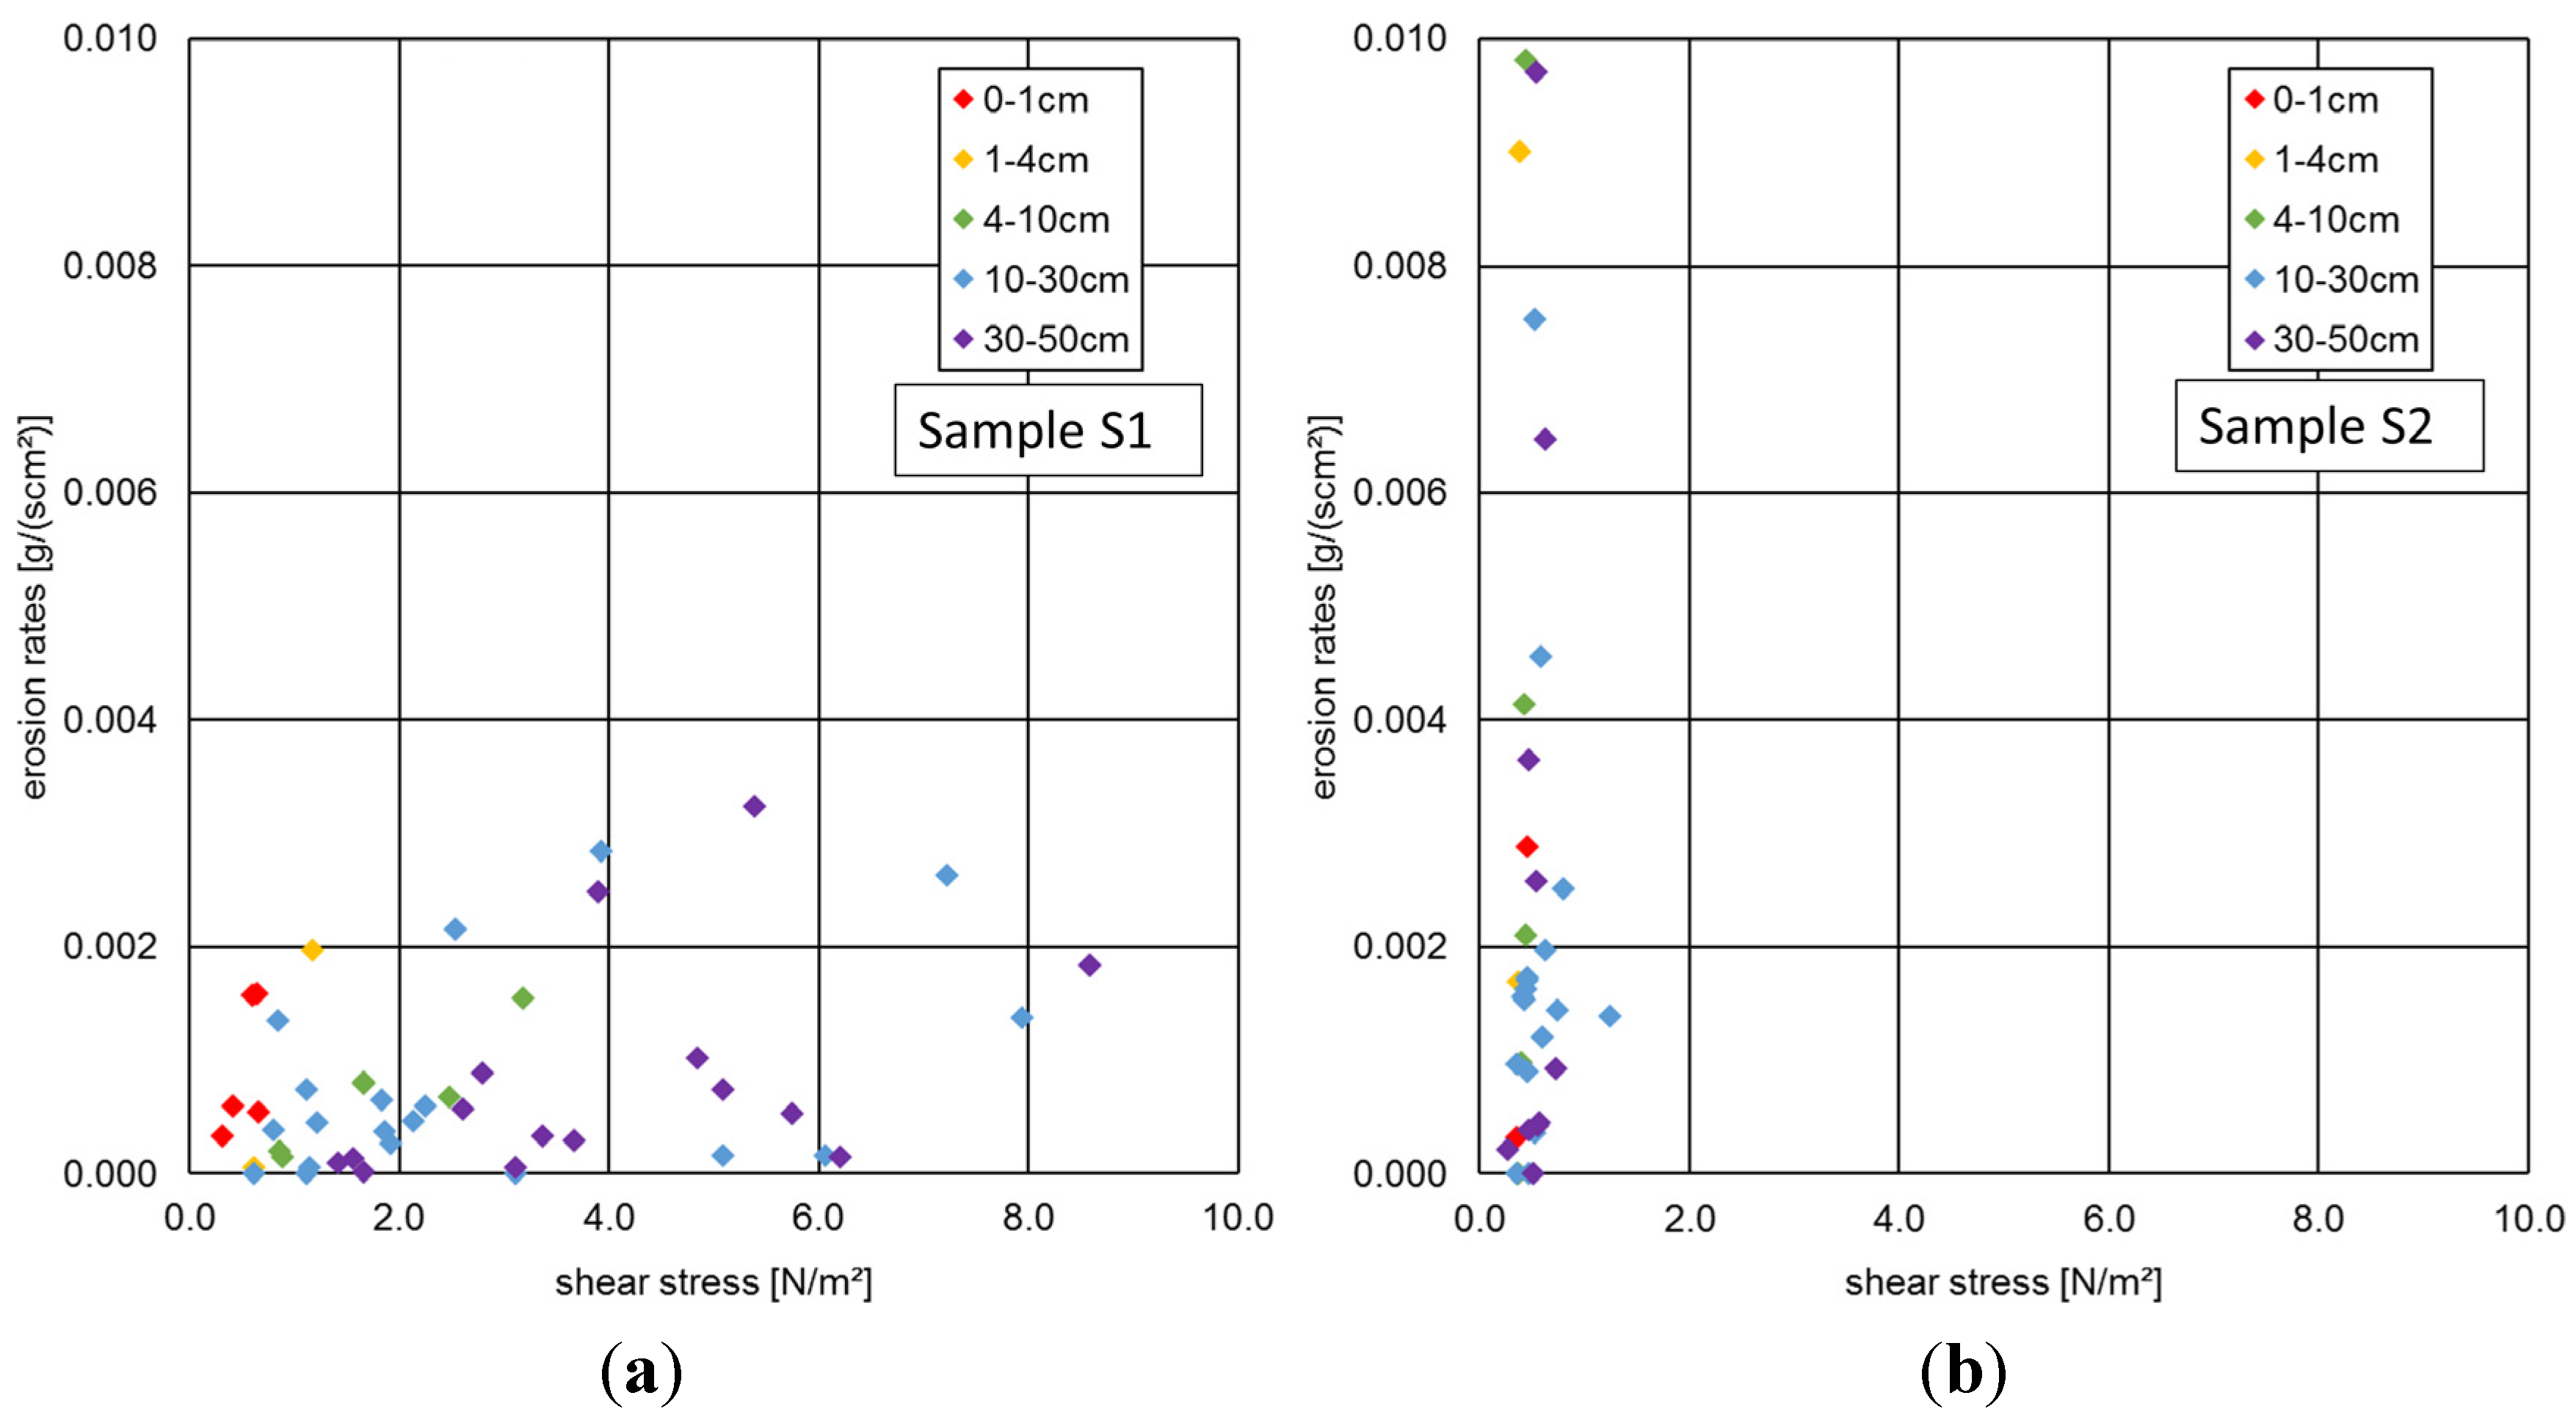
4.1. Laboratory Analyses of the Sediment Cores from the River Elbe

In total six groyne fields and 30 locations with at least two sediment cores each were investigated in the River Elbe [30]. The first core served for the non-destructive determination of the bulk density followed by erosion tests to derive critical shear stresses and erosion rates. The second core was sectioned into various sediment layers of interest and three sub-samples (triplicates) were taken for each sediment depth to analyze the particle size distribution.
As an example, Figure 3 shows the results of two sampling sites (E1, E2) in the River Elbe which are located at river kilometer 434.6 (E1) and 509.4 (E2). The left graph plots the vertical profiles of critical shear stress and bulk density while the right graph illustrates the assigned particle size distribution for distinct layers. As expected, both samples show a high vertical heterogeneity with varying characteristics in the sediment layers.
For sampling site E1 low critical shear stresses (approximate 0.5 N/m2) are measured for the upper 20 cm of the sediment core, followed by a significant increase of the critical shear stresses up to 2.4 N/m2 at a sediment depth of 32 cm. A similar behavior is shown for the bulk density with one local maximum around 30 cm depth indicating less pore space, lower water content and thus a higher consolidation (Figure 3a). In addition, the particle size distribution of the sediment layer between 25 and 35 cm reveals a high proportion of clay and silty material (93%) and little contribution of sandy material (7%) (Figure 3b). Hence, it can be concluded that the cohesive forces are the reason for the increase in erosion stability and bulk density in this sediment layer. For deeper sediment layers (> 45 cm), the critical shear stress declined again along with increasing sand contents. The layer 35 cm to 45 cm shows the highest sand proportion (up to 67%) that is also reflected in a second local maximum of bulk density. Like for the layer dominated by fine-grained particles, the lower water content and the reduced pore space of sandy layers result in a high bulk density although the sand is clearly devoid of cohesive forces.
Figure 3. (a) Vertical profiles of sediment bulk density and critical shear stress based on laboratory measurements for two sampling sites in the River Elbe (E1 and E2); (b) particle size distributions at distinct sediment layers of the two sampling sites in the River Elbe (E1 and E2).
Water 07 05061 g003
The sampling site E2 shows as well low sediment stability at the upper layers that increases from 30 cm depth onwards to reach a maximum at about 50 cm depth. Overall, the bulk density shows a modest increase over depth too (Figure 3a) indicating enhanced consolidation. However, the sudden maximum of bulk density at a depth of 25 cm is not related to consolidation processes but to the presence of a sandy layer as proofed by particle size determination. As described above for the core E1, this is explained by the reduced pore space in sand as compared to silty material, but it does not impact sediment stability much as can be seen in Figure 3a. Next to the sand layer, a significant increase of the very fine grained fractions (clay, fine silt) with sediment depth can be identified in Figure 3b. While the clay fraction increases from 4% to 8%, the fine silt fraction shows an increase from 11% to 16%. This enhanced proportion of fine fractions contributes to the higher erosion stabilities determined in these layers.
Figure 4a,b show the erosion rates detected for both sediment samples (E1, E2) at shear stresses exceeding the critical threshold. The two sediment samples seem to indicate a slightly different erosion behavior: while sample E1 is characterized by a relatively high erosion stability, and consequently low erosion rates up to shear stresses of 5 N/m2, sample E2 shows more of a consistent increase in erosion rates originating from all sediment layers along with enhanced hydraulic forces.
To provide information about the measured data of all sampling sites in the River Elbe, the box plots in Figure S1 of the Supplementary File represent the measured ranges of critical shear stresses, bulk densities, and particle size distributions, whereby the latter are averaged over depths.
Figure 4. Measured erosion rates in the River Elbe at a stepwise increase of hydraulic forces expressed by shear stresses ((a): sample E1, (b): sample E2). The colors indicate the different sediment layers over depths.
Water 07 05061 g004

4.2. Laboratory Analyses of the Sediment Cores from the River Saale

In the catchment of the River Saale in total fifteen sites were investigated in 2012, which encompass the River Saale itself and the tributaries Weisse Elster, Bode, and Schlenze. The sampling sites were selected as being representative for typical deposition areas of fine sediments and in cooperation with the State Agency for Flood Defense and Water Management of Saxony-Anhalt in Germany [31]. Comparable to the measuring campaigns in River Elbe, at least two sediment cores were withdrawn at each location to determine bulk density followed by sediment stability as well as for sediment core sectioning and subsequent particle analysis. The sampling site S1 is located in the backwater area of the weir Bad Dürrenberg at the River Saale, while the sampling site S2 is situated in the tributary Weisse Elster. Again as an example, the vertical profiles of the bulk density and critical shear stress are plotted for these two samples (S1, S2) from the catchment of the River Saale (Figure 5a).
The vertical profile of critical shear stress of sample S1 shows increasing values over depth, similar, although less pronounced, to the bulk density. At the sediment surface, low critical shear stresses (0.3 N/m2) prevails and this increase to more than 4.0 N/m2 at a sediment depth of about 50 cm. At the same time, the bulk density is low at the sediment surface (1.15 t/m3) and raises up at a depth of 60 cm (1.45 t/m3) to indicate an increasing consolidation over depth. The particle size distributions for different sediment layers in Figure 5b show no signs of significant sand layers in this sample. Regarding the clay and silt contents, a general increase is detected over depth that might explain the more pronounced increase in sediment stability.
Figure 5. (a) Vertical profiles of sediment bulk density and critical shear stress based on laboratory measurements for two sampling sites in the catchment of River Saale (S1 and S2); (b) particle size distributions at distinct layers of the two sampling sites in the catchment of River Saale (S1 and S2).
Water 07 05061 g005
The sample S2 is characterized by a rather homogenous distribution of critical shear stress (0.3 N/m2) over sediment depth (Figure 5a). Additionally, the bulk density profile shows no sign of an increase over depth but a few pronounced peaks that are related to high sand contents of this sample (Figure 5b). However, a possible impairment of the sediment stability by these sandy layers cannot be reported since the values of critical shear stress are generally low.
In Figure 6, the measured erosion rates against the shear stresses (above the critical threshold) are presented for both samples from the catchment of the River Saale (S1, S2). For S1, the erosion rates hardly exceed 0.003 g/scm2 and while the sediment surface (0.0–1.0 cm) became quite easily eroded at lower shear stresses (<1.0 N/m2), deeper layers required shear stresses up to 9.0 N/m2 to be eroded. This reflects the increasing critical shear stress over depth as it is plotted in Figure 6a. In contrast, all sediment layers of S2 were eroded at shear stresses lower than 1.0 N/m2; this reveals the rather low and homogenous distribution of the critical shear stress in Figure 5a. Hence, the sediment sample S2 is characterized by a high erosion risk.
To provide information about the measured data of all sampling sites in the catchment of River Saale, the box plots in Figure S2 of the Supplementary File represent the measured ranges of critical shear stresses, bulk densities, and particle size distributions, whereby the latter are averaged over depths.
Figure 6. Measured erosion rates in the catchment of River Saale at a stepwise increase of hydraulic forces expressed by shear stresses ((a): sample S1, (b): sample S2). The colors show the different sediment layers over depths.
Water 07 05061 g006

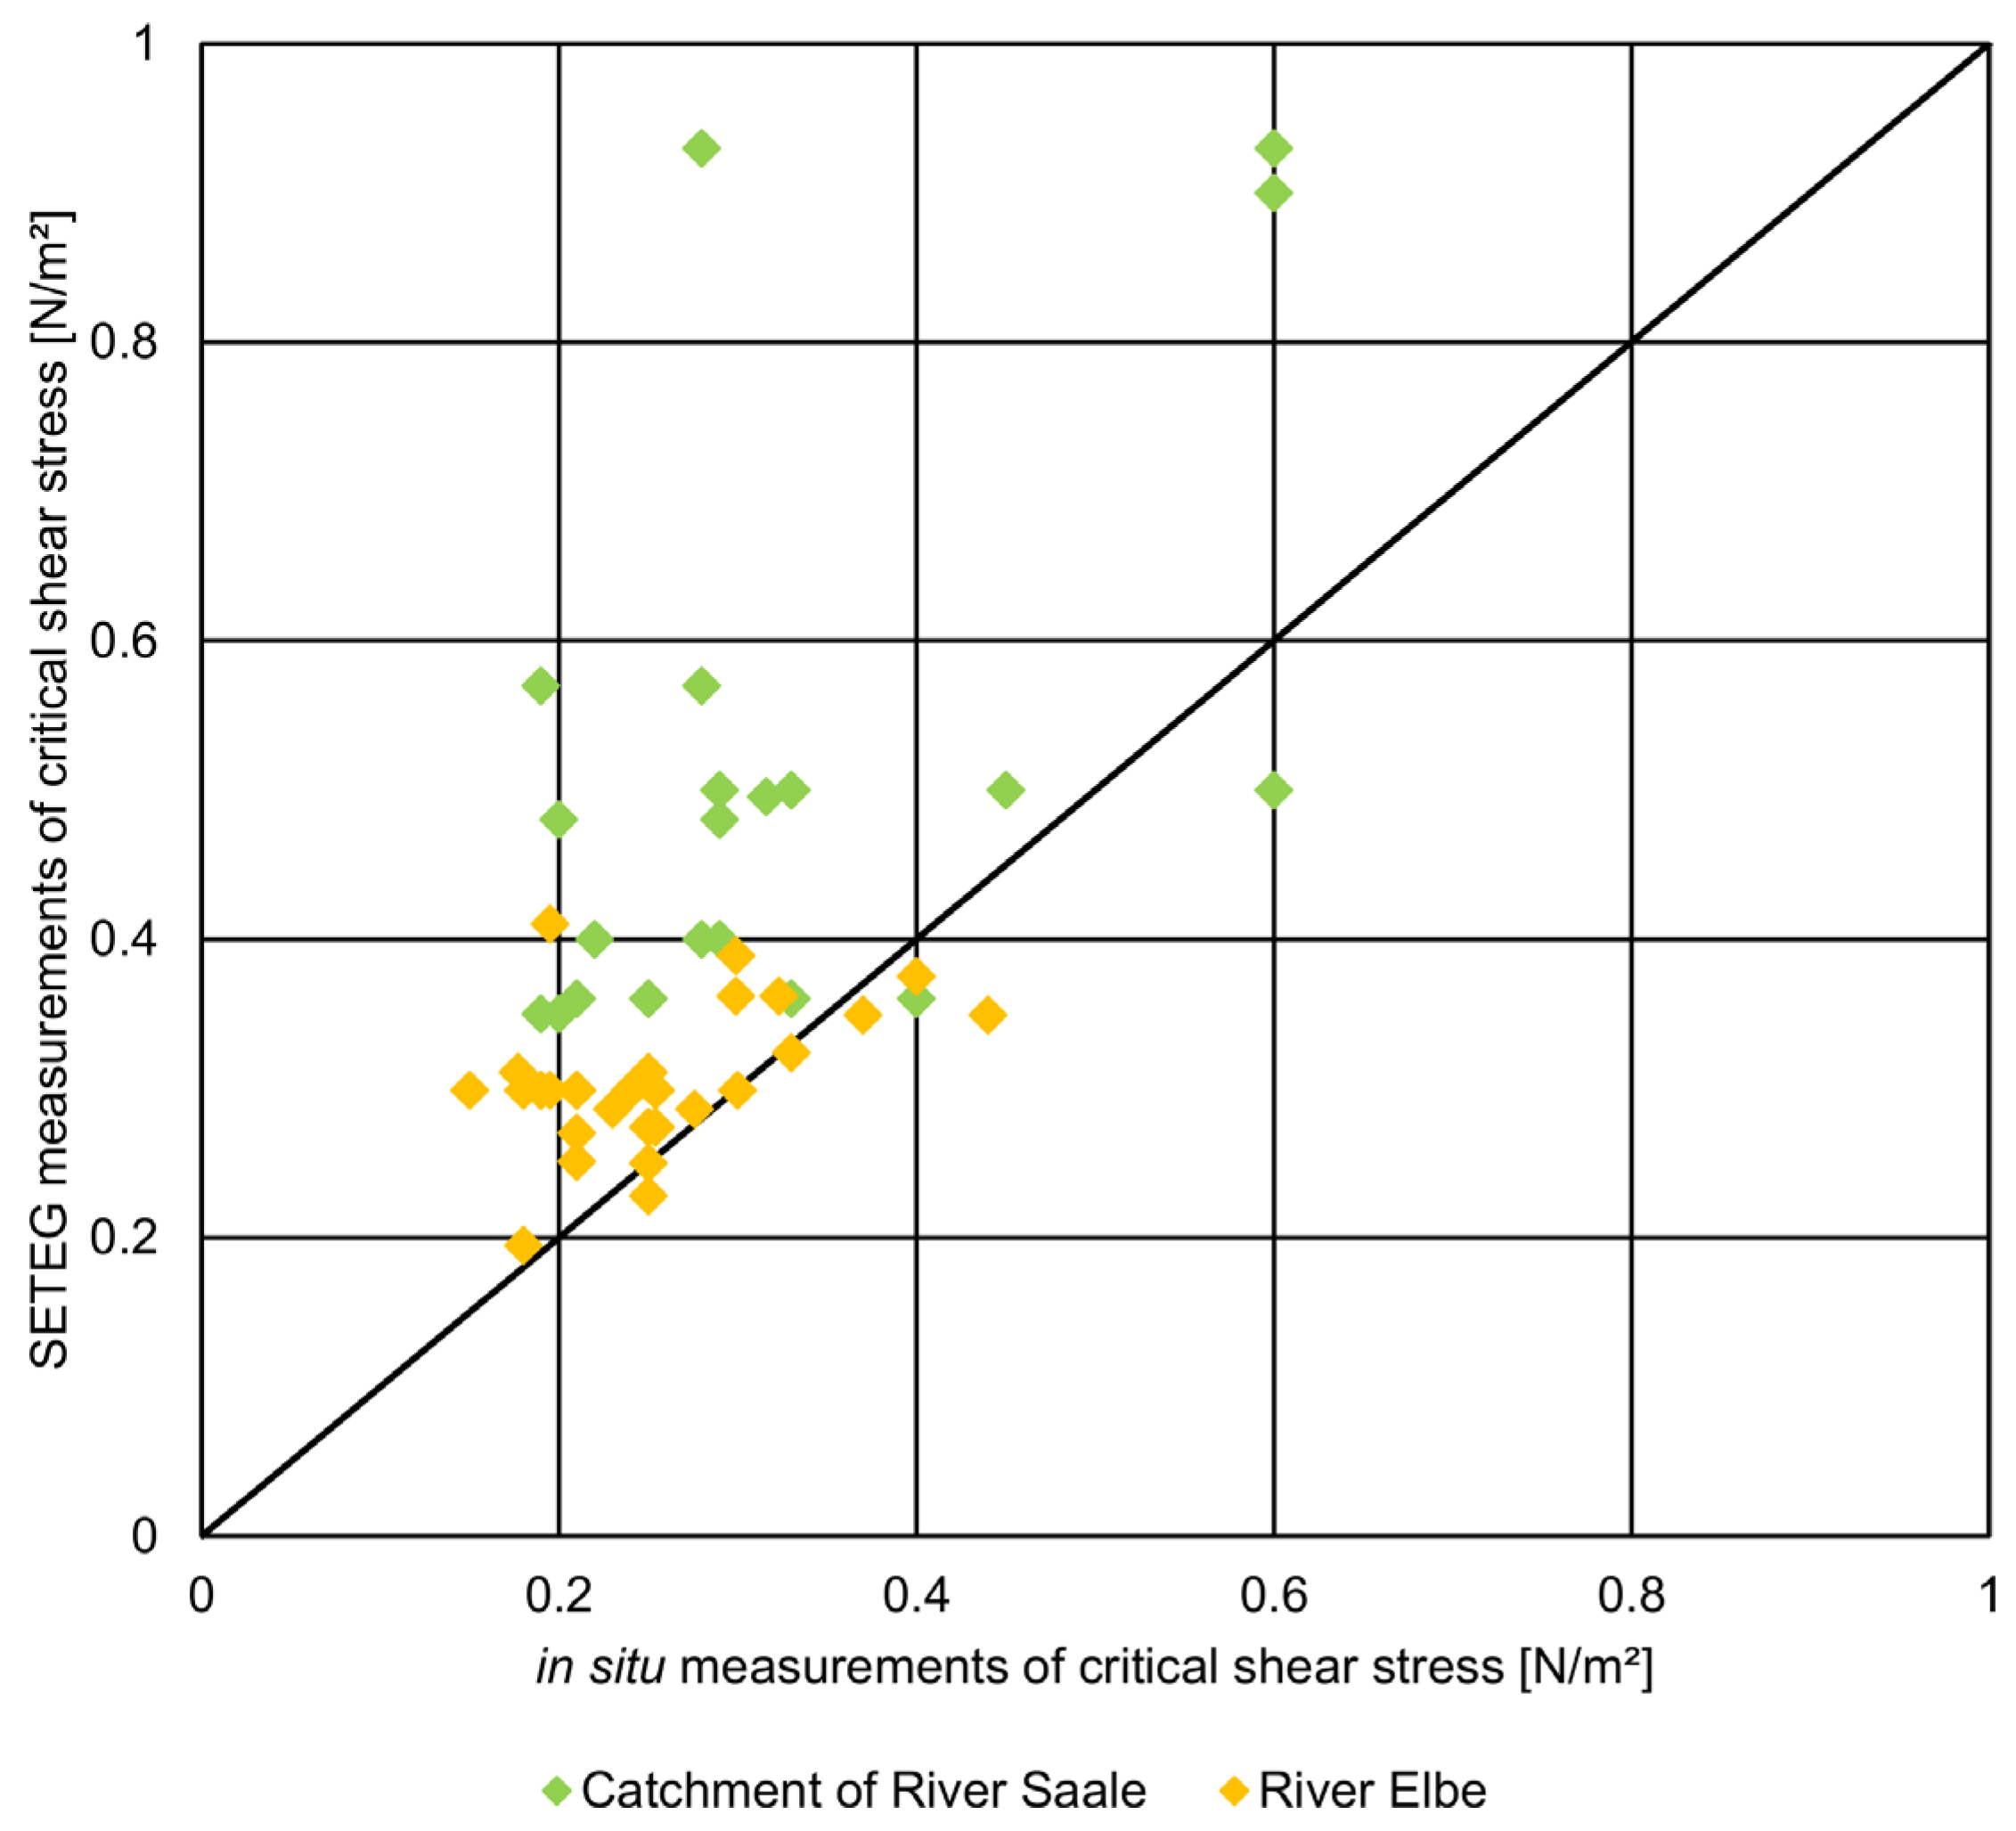
4.3. Comparison of Critical Shear Stress Values between Laboratory and in situ Measurements

The combined procedure of measuring the critical shear stress in situ and after withdrawal of sediment cores in the laboratory gives the unique opportunity to compare the results of both approaches. However, this is only feasible for the sediment surface because the in situ measurements do not allow depth-dependent analysis so far. Figure 7 plots the measured critical shear stresses at the sediment surface obtained in the laboratory against the values recorded by the in situ device.
Figure 7. Comparison of critical shear stress measurements by the SETEG-flume in the laboratory and the in situ device for both study sites (River Elbe and River Saale catchment).
Water 07 05061 g007
For the River Elbe, the in situ critical shear stresses range from 0.15 N/m2 to 0.37 N/m2 with a mean value of 0.25 N/m2. The values obtained by the SETEG-flume are in a similar range (0.19 N/m2 to 0.41 N/m2); however, their mean critical shear stress with a value of 0.30 N/m2 is slightly higher. The River Saale samples show critical shear stress values that deviate even stronger between the in situ (mean value 0.32 N/m2) and laboratory measurements (mean value 0.46 N/m2).
The differences between the in situ and laboratory data most likely result from the different recognition of the flocculent surface layer on top of the consolidated sediments. This flocculent layer consists of recently deposited and thus loosely-attached flocs that might easily be washed away or disturbed by withdrawing and transporting sediment cores. In contrast, by positioning the in situ device carefully onto the sediment surface, the features of undisturbed top layer are fully addressed and incorporated in the determination of the critical shear stresses.

5. Discussion

The aim of the studies in the River Elbe and in the catchment of the River Saale was to investigate and evaluate the erosion risk of deposited contaminated cohesive sediments. Therefore, a twofold measuring strategy was applied in both case studies. On the one hand, in situ measurements were conducted to obtain information about critical shear stresses at the sediment surface. On the other hand, sediment cores were withdrawn for depth-dependent analysis in the laboratory of critical shear stresses, erosion rates, bulk densities, and particle size distributions.
The in situ data show slightly different and often lower values as compared to the laboratory measurements. According to [32,33] these discrepancies can be explained by treatment/withdrawal, handling, transporting, and possibly storing of sediment cores, all of which might further compact the sediment to result in higher strength as compared to natural values. Moreover, the flocculent surface layer can be retained and addressed within in situ devices to give lower values of incipient motion while being washed away during sediment withdrawal for the laboratory, thereby exposing more consolidated layers beneath. Beside the consideration of the flocculent surface layer, the dominant advantage of the in situ device is the direct determination in the field allowing for plausibility checks and immediate repeatability, while the most important drawbacks are the limited capability of doing vertical investigations of the erosional behavior and sediment characteristics such as bulk density, etc. Especially when considering the risk to remobilize pollutants of the past (“old burden”), the stability of deeper layers, where most of the contaminated sediments are deposited long ago, is of high importance. This is but one reason why sediment stability of deeper layers is one crucial parameter in the risk assessment of contaminated sediments [34]. Furthermore, sediments are ideal recorders of past environmental conditions and thus, the depth-dependent determination in the laboratory provides a precise chronology of historical hydrological events such as discrete floods or runoff patterns that will help to better predict possible scenarios in the future.
The withdrawal of sediment cores allows, beside depth-dependent analyses, for an examination of additional sedimentary parameters, which may influence the incipient motion and erosion rates of cohesive sediments. One example is the bulk density, which is a measure of the different proportion of sediments, water and gases in the sediment sample. Hence, the bulk density indicates the degree of consolidation for cohesive sediments [35]. Consequently, there is usually a positive correlation of bulk densities with sediment stability: in other words, high bulk densities result in high erosion thresholds and low erosion rates. This has been described in several investigations detecting an increase of erosion stability with enhanced consolidation, especially for deeper sediment layers e.g., [27,36,37]. Another important sedimentary parameter is the particle size distribution and it is well-known that increasing clay and silt contents lead to an increase in erosion stability e.g., [38,39]. Thus, a positive correlation between fine-grained sediments and erosion thresholds can be expected. Vice versa, high amounts of sand fractions result in low erosion stability e.g., [40] implying a negative correlation between sand contents and critical shear stress.
The described relations reported in previous studies are generally verified by the analyses of the sediment samples from the River Elbe and the catchment of the River Saale. For example, the samples E2 and S1 show increasing values of both critical shear stress and bulk density over sediment depths to indicate an enhanced consolidation and higher sediment stability for deeper sediment layers as compared to the surface layers. Secondly, the sample E2 of the River Elbe includes a sediment layer with a high content of sand fractions with low water content and a local maximum in bulk density. Still, given the non-cohesive erosion behavior of sand, low critical shear stresses were detected here. Moreover, this sand layer points to a past hydrological event of higher discharge that most likely transported the clay and silty fractions further downstream, while the heavier sand fractions could deposit. With subsequently lower flow conditions after the flood event, the sand depositions have been overlaid by silt depositions resulting in the present stratification of the sediment samples.
Measurements of erosion thresholds of cohesive sediments have been conducted in different environments including sea beds [41,42], wetlands and tidal flats [43,44], lakes [45], mountain reservoirs [46] and in different river sections where fine sediment can deposit such as groyne fields, side structures or harbors [26,34,47]. Debnath and Chaudhuri [48] published an overview with a wide range of erosion thresholds including mostly marine, estuarine, and tidal environments. Harb et al. [46] provides a data collection on sediment stability obtained in mountain reservoirs. Since most of the measuring devices are not able to do depth-dependent analyses, the values of these previous studies concern surface values. To put our data into the international context, we initially oppose the erosion thresholds of the surface layers only. Nevertheless, the different environments as well as the various measuring techniques applied, hamper the direct comparison. For instance, the critical shear stresses reported from mountain reservoirs are between 0.8 N/m2 and 13.0 N/m2 with a medium and upper range of values that is far higher than the erosion thresholds determined in the Rivers Elbe and Saale samples. This can be explained by a usually higher level of consolidation and substantially higher amounts of clay fractions (10%–60%), which are typical for mountain reservoirs. For marine environments and especially tidal flats, there is a similar trend of higher critical shear stresses as they are expected due to the stabilizing effect of the high saline environment (enhanced inter-particle forces due to cations) and the immersion/emersion periods (developing microalgal mats and desiccation). Tolhurst et al. (2000) [33], for instance, listed values between 3 and 17 N/m2. In contrast, Debnath et al. [26] obtained comparatively lower values from 0.01 N/m2 to 0.39 N/m2 at several rivers in the United Kingdom that are well within the range of the data from the Rivers Elbe and Saale. Like in our studies, the former authors applied an in situ device where the values seem to be consistently lower as compared to the laboratory measurements [33].
Naturally, previous studies in riverine sediments that included depth-dependent analyses, revealed much higher critical shear stress values as compared to the results for the surface layers. For instance, Haag et al. [34] measured in a backwater area of the River Neckar (Germany) a range of 0.6 N/m2 to 8.5 N/m2 with a mean value of 4.5 N/m2 including surface and depth-dependent analyses. Gerbersdorf et al. [14] measured in the same river a range of 2.5 to 4.5 N/m2 in deeper layers and values lower than 2.0 N/m2 in upper horizons. Consequently, these erosion thresholds seem consistently higher than in the present samples from Rivers Elbe and Saale which might be reasoned by the higher clay contents (20%–46%) in the River Neckar samples [14,33].
In summary, the wide range of erosion thresholds reported by various research labs underlines the highly spatially and temporally varying characteristics of cohesive sediments and how they make predictions of their erosional behavior very difficult, if not impossible. Hence, future research needs to better unravel the complex physico-chemical and biological properties of cohesive sediments and to relate this to sedimentary behavior in order to enhance the prediction of sediment dynamics further [5]. So far, direct measurements are still required and thereby, an ideal approach is to combine both, in situ measurements and laboratory investigations to allow for the proper observation of the flocculent surface layer and a depth-dependent examination of sediment characteristics, respectively.

6. Conclusions

To examine the potential erosion risk of cohesive sediments in the River Elbe and in the catchment of the River Saale, in situ measurements of critical shear stress values are combined with laboratory analyses of withdrawn sediment cores that allow depth-dependent evaluation of the critical shear stress and erosion rates as well as essential sedimentary parameters such as bulk density and particle size distribution.
The values for the erosional behavior of the surface layers obtained by the in situ device are generally much lower as compared to the laboratory measurements. Presumably, the flocculent surface layer remains largely intact within the in situ device where it can be quite easily eroded due to its fluffy character. In contrast, the flocculent surface layer is mostly lost during withdrawal of sediment cores or disturbed while being transported to the laboratory.
However, as the in situ device allows investigations of the surface layer only, the examination of withdrawn sediment cores is indispensable for analyzing sediment stability and characteristics in deeper layers; a prerequisite to determine the erosion potential of long-deposited and often contaminated sediments or to get more insights into historical hydrological events. Consequently, both approaches, field and laboratory, provide complementary insights into sediment behavior; thus applying both seems to be the most promising measuring strategy.
The analysis of sedimentary parameters demonstrate that the complex erosion and suspension behavior of cohesive sediments cannot be described sufficiently by one- or two-parametric measurements but requires a more detailed exploration, especially in parameters describing the binding forces. While the strategy of combining in situ and laboratory devices gives important clues to the sediment stability of certain spots at the very moment of these measurements; possible interpolation of the data and prediction of future sediment dynamic can only be ensured by a fundamental knowledge on fine sediment behavior, including not only sedimentary but also chemical and biological parameters.

Supplementary Files

Supplementary File 1

Acknowledgments

The authors would like to acknowledge the German Federal Waterways and Shipping Authority in conjunction with the German Federal Institute of Hydrology and the Agency for Flood Defense and Water Management of Saxony-Anhalt for funding and their support during the measuring campaigns. The laboratory devices presented here were established by the former work group of Bernhard Westrich as noted by the references and are continuously developed further by the group of Silke Wieprecht. This work was supported by the German Research Foundation (DFG) within the funding program Open Access Publishing.

Author Contributions

Markus Noack and Sabine U. Gerbersdorf wrote the manuscript and analyzed the data under supervision of Silke Wieprecht while Gudrun Hillebrand selected the study sites in the River Elbe and contributed in data interpretation. All authors contributed equally in the literature review and the discussion and conclusion.

Conflicts of Interest

The authors declare no conflict of interest.

References

  1. Owens, P.N.; Batalla, R.; Collins, A.J.; Gomez, B.; Hicks, D.M.; Horowitz, A.J.; Kondolf, G.M.; Marden, M.; Page, M.J.; Peacock, D.H.; et al. Fine-grained sediment in river systems: Environmental significance and management issues. River Res. Appl. 2005, 21, 693–717. [Google Scholar] [CrossRef]
  2. Heise, S.; Förstner, U. Risk assessment of contaminated sediments in river basins—Theoretical considerations and pragmatic approach. J. Environ. Monit. 2007, 9, 943–952. [Google Scholar] [CrossRef] [PubMed]
  3. The SedNet Strategy Paper. Available online: http://www.sednet.org/download/SedNet_strategic_paper_2004.pdf (accessed on 14 September 2015).
  4. Black, K.S.; Tolhurst, T.J.; Paterson, D.M.; Hagerthey, S.E. Working with natural cohesive sediments. J. Hydraul. Eng. 2002, 128, 2–8. [Google Scholar] [CrossRef]
  5. Gerbersdorf, S.U.; Wieprecht, S. Biostabilization of cohesive sediments: Revisiting the role of abiotic conditions, physiology and diversity of microbes, polymeric secretion, and biofilm architecture. Geobiology 2015, 13, 68–97. [Google Scholar] [CrossRef] [PubMed]
  6. Paterson, D.M. Short-term changes in the erodibility of intertidal cohesive sediments related to the migratory behavior of epipelic diatoms. Limnol. Oceanogr. 1989, 34, 223–234. [Google Scholar] [CrossRef]
  7. Amos, C.L.; Grant, J.; Daborn, G.R.; Black, K. Sea Carousel—A benthic, annular flume. Estuar. Coast. Shelf Sci. 1992, 34, 557–577. [Google Scholar] [CrossRef]
  8. McNeil, J.; Taylor, C.; Lick, W. Measurements of erosion of undisturbed bottom sediments with depth. J. Hydraul. Eng. 1996, 122, 316–324. [Google Scholar] [CrossRef]
  9. Gust, G.; Muller, V. Interfacial hydrodynamics and entrainment functions of currently used erosion devices. Cohes. Sediment. 1997, 5, 149–171. [Google Scholar]
  10. Kern, U.; Haag, I.; Schürlein, V.; Holzwarth, M.; Westrich, B. Ein Strömungskanal zur ermittlung der tiefenabhängigen Erosionsstabilität von Gewässersedimente. Wasserwirtschaft 1999, 89, 72–77. (In German) [Google Scholar]
  11. Roberts, J.D.; Jepsen, R.A.; James, S.C. Measurements of sediment erosion and transport with the adjustable shear stress erosion and transport flume. J. Hydraul. Eng. 2003, 129, 862–871. [Google Scholar] [CrossRef]
  12. Aberle, J.; Nikora, V.; McLean, S.; Doscher, C.; McEwan, I.; Green, M.; Goring, D.; Walsh, J. Straight benthic flow-through flume for in situ measurement of cohesive sediment dynamics. J. Hydraul. Eng. 2003, 129, 63–67. [Google Scholar] [CrossRef]
  13. Westrich, B.; Schmid, G.; Witt, O. Comprehensive investigation on cohesive sediment erodibility by field and laboratory experiments. In 30th IAHR Congress: Water Engineering and Research in a Learning Society; Ganoulis, J., Prinos, P., Eds.; Aristoteleio Panepistimio Thessalonikis: Thessaloniki, Greece, 2003. [Google Scholar]
  14. Gerbersdorf, S.U.; Jancke, T.; Westrich, B. Physico-chemical and biological sediment properties determining erosion resistance of contaminated riverine sediments—Temporal and vertical pattern at the Lauffen reservoir/River Neckar, Germany. Limnol.-Ecol. Manag. Inland Waters 2005, 35, 132–144. [Google Scholar] [CrossRef]
  15. Förstner, U.; Heise, S.; Schwartz, R.; Westrich, B.; Ahlf, W. Historical contaminated sediments and soils at the river basin scale: Examples from the Elbe river catchment area. J. Soils Sediment. 2004, 4, 247–260. [Google Scholar] [CrossRef]
  16. Lick, W.J. Sediment and Contaminant Transport in Surface Waters; CRC Press: Boca Raton, FL, USA, 2009. [Google Scholar]
  17. Wölz, J.; Cofalla, C.; Hudjetz, S.; Roger, S.; Brinkmann, M.; Schmidt, B.; Schäffer, A.; Kammann, U.; Lennartz, G.; Hecker, M.; et al. In search for the ecological and toxicological relevance of sediment re-mobilisation and transport during flood events. J. Soils Sediment. 2008, 9, 1–5. [Google Scholar] [CrossRef]
  18. Westrich, B.; Förstner, U. Sediment Dynamics and Pollutant Mobility in Rivers—An Interdisciplinary Approach; Springer: Berlin, Germany, 2007. [Google Scholar]
  19. Gerbersdorf, S.U.; Hollert, H.; Brinkmann, M.; Wieprecht, S.; Schüttrumpf, H.; Manz, W. Anthropogenic pollutants affect ecosystem services of freshwater sediments: The need for a “triad plus x” approach. J. Soils Sediment. 2011, 11, 1099–1114. [Google Scholar] [CrossRef]
  20. Moshenberg, K.L. Fate and Transport Modeling of Cohesive Sediment and Sediment-Bound HCB in the Middle Elbe River Basin. Ph.D. Thesis, Technical University Hamburg-Harburg, Hamburg, Germany, October 2013. [Google Scholar]
  21. Witt, O.; Westrich, B. Qunatification of erosion rates for undistrubed contaminated cohesive sediment cores by image analysis. Hydrobiologia 2003, 494, 271–276. [Google Scholar] [CrossRef]
  22. Tolhurst, T.J.; Black, K.S.; Paterson, D.M. Muddy sediment erosion: Insights from field studies. J. Hydraul. Eng. 2009, 135, 73–87. [Google Scholar] [CrossRef]
  23. Hartmann, S. Entwicklung einer Strategie zur in situ Ermittlung der kritischen Erosionsgeschwindigkeit. Ph.D. Thesis, Universität der Bundeswehr München, München, Germany, June 1997. [Google Scholar]
  24. Schwartz, R.; Gerth, J.; Neumann-Hensel, H.; Förstner, U. Assessment of highly polluted fluvisol in the Spittelwasser floodplain based on national guideline values and MNA-criteria. J. Soils Sediment. 2006, 6, 145–155. [Google Scholar] [CrossRef]
  25. Aberle, J. Measurement techniques for the estimation of cohesive sediment erosion. In Hydraulic Methods for Catastrophes: Floods, Droughts, Environmental Disasters; Rowiński, P.M., Ed.; Institute of Geophysics Polish Academy of Sciences: Warszawa, Poland, 2008. [Google Scholar]
  26. Debnath, K.; Nikora, V.; Aberle, J.; Westrich, B.; Muste, M. Erosion of cohesive sediments resuspension, bed load, and erosion patterns from field experiments. J. Hydraul. Eng. ASCE 2007, 133, 508–520. [Google Scholar] [CrossRef]
  27. Schweim, C. Modellierung und Prognose der Erosion Feiner Sedimente. Ph.D. Thesis, RWTH Aachen University, Aachen, Germany, April 2005. [Google Scholar]
  28. Lorch, S. Automatische Registrierung der Feuchtdichte und der Wassergehaltsänderung eines Bodens durch Messung der Absorption von Gammastrahlen (Geländemessung). Z. Pflanzenernaehr. Bodenk. 1971, 130, 136–151. (In German) [Google Scholar]
  29. Capello, S.V. Modeling Channel Erosion in Cohesive Streams of the Blackland Prairie, Texas at the Watershed Scale. Master Thesis, Baylor University, Waco, TX, USA, August 2008. [Google Scholar]
  30. Wieprecht, S.; Hartmann, S.; Schmid, G. Erosionsmessung Elbe-Buhnenfelder; University of Stuttgart: Stuttgart, Germany, 2013. (In German) [Google Scholar]
  31. Wieprecht, S.; Hartmann, S.; Schmid, G. Ermittlung des Resuspensionspotentials Belasteter Altsedimente in Ausgewählten Gewässern Sachsen-Anhalts; University of Stuttgart: Stuttgart, Germany, 2013. (In German) [Google Scholar]
  32. Houwing, E.-J.; van Rijn, L.C. In Situ Erosion Flume (ISEF): Determination of bed-shear stress and erosion of a kaolinite bed. J. Sea Res. 1998, 39, 243–253. [Google Scholar] [CrossRef]
  33. Tolhurst, T.J.; Riethmüller, R.; Paterson, D.M. In situ versus laboratory analysis of sediment stability from intertidal mudflats. Cont. Shelf Res. 2000, 20, 1317–1334. [Google Scholar]
  34. Haag, I.; Kern, U.; Westrich, B. Erosion investigation and sediment quality measurements for a comprehensive risk assessment of contaminated aquatic sediments. Sci. Total Environ. 2001, 266, 249–257. [Google Scholar] [PubMed]
  35. Grabowski, R.C.; Droppo, I.G.; Wharton, G. Erodibility of cohesive sediment: The importance of sediment properties. Earth-Sci. Rev. 2011, 105, 101–120. [Google Scholar] [CrossRef]
  36. Sills, G.C.; Been, K. Self-weight consolidation of soft soils: An experimental and theoretical study. Géotechnique 1981, 31, 519–535. [Google Scholar]
  37. Kuijper, C.; Cornelisse, J.M.; Winterwerp, J.C. Research on erosive properties of cohesive sediments. J. Geophys. Res. Oceans 1989, 94, 14341–14350. [Google Scholar] [CrossRef]
  38. Amos, C.L.; Mosher, D.C. Erosion and deposition of fine-grained sediments from the Bay of Fundy. Sedimentology 1985, 32, 815–832. [Google Scholar] [CrossRef]
  39. Lick, W.; Lick, J.; Jin, L.; Gailani, J. Approximate equations for sediment erosion rates. In Marine Science, Estuarine and Coastal Fine Sediments Dynamics Intercoh; Elsevier: Amsterdam, The Netherlands, 2007; pp. 109–127. [Google Scholar]
  40. Gerbersdorf, S.U.; Jancke, T.; Westrich, B. Sediment properties for assessing the erosion risk of contaminated riverine sites. An approach to evaluate sediment properties and their covariance patterns over depth in relation to erosion resistance. First investigations in natural sediments. J. Soils Sediment. 2007, 7, 25–35. [Google Scholar] [CrossRef]
  41. Young, R.N.; John, S.B. Erosion of fine-grained marine sediments: Sea-floor and laboratory experiments. Geol. Soc. Am. Bull. 1978, 89, 663–672. [Google Scholar] [CrossRef]
  42. Maa, J.P.-Y.; Wright, L.D.; Lee, C.-H.; Shannon, T.W. VIMS sea carousel: A field instrument for studying sediment transport. Mar. Geol. 1993, 115, 271–287. [Google Scholar] [CrossRef]
  43. Widdows, J.; Brinsley, M.D.; Bowley, N.; Barrett, C. A benthic annular flume for in situ measurement of suspension feeding/biodeposition rates and Erosion potential of intertidal Cohesive Sediments. Estuar. Coast. Shelf Sci. 1998, 46, 27–38. [Google Scholar] [CrossRef]
  44. Aberle, J.; Nikora, V.; Walters, R. Data interpretation for in situ measurements of cohesive sediment erosion. J. Hydraul. Eng. ASCE 2006, 132, 581–588. [Google Scholar] [CrossRef]
  45. Righetti, M.; Lucarelli, C. May the shields theory be extended to cohesive and adhesive benthic sediments? J. Geophys. Res. Oceans 2007, 112. [Google Scholar] [CrossRef]
  46. Harb, G.; Haun, S.; Schneider, J. Evaluation of critical shear stress of cohesive sediments by using PIV compared with vane strength measurements. In Advances in River Sediment Research; Fukuoka, S., Nakagawa, H., Sumi, T., Zhang, H., Eds.; CRC Press: Boca Raton, FL, USA, 2013. [Google Scholar]
  47. Noack, M.; Gerbersdorf, S.; Wieprecht, S.; Hillebrand, G.; Kasimir, P. How to determine the erosion risk of contaminated cohesive sediments best? Putting in situ and laboratory practices to the test. In River Flow 2014; CRC Press: Boca Raton, FL, USA, 2014; pp. 2235–2242. [Google Scholar]
  48. Debnath, K.; Chaudhuri, S. Cohesive sediment erosion threshold: A review. ISH J. Hydraul. Eng. 2010, 16, 36–56. [Google Scholar] [CrossRef]

