


errata, addenda, magnetic fields, masers, polarization, stars: AGB and post-AGB, planetary nebulae: general
In our paper ‘Polarization properties of OH emission in planetary nebulae’, published in MNRAS, 461(3), 3259–3273 (2016), the coordinates in Fig. 7 were incorrectly labelled. The correct version of this figure is presented here. The coordinates in the tables are correct. The discussion in the paper is not affected by this change.
Figure 7.
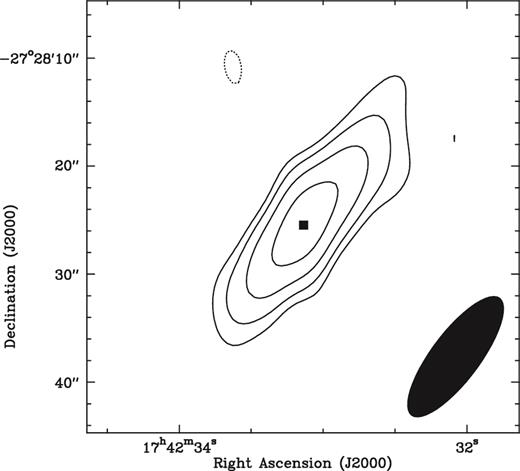
Contour map of the continuum emission in IRAS 17393−2727. The contour levels are 3 × 2n times 25 μJy beam−1 (the rms of the map), with n = 0–3. The black square marks the location of peak emission at 1612 MHz. The other maser components appear at the same location in the image. The filled ellipse represents the synthesized beam of the continuum image (13.6 × 4.5 arcsec2, p.a. = −37°).
© 2017 The Authors Published by Oxford University Press on behalf of the Royal Astronomical Society
